1.23 FAQ-136 How do I add and customize tables in a graph?Add-Table-to-Graph
Last Update: 12/9/2022
The user can take several approaches:
Insert a worksheet
This option works best in versions 2023 and beyond (while it worked to some extent in earlier versions, it was clumsy to use -- see this OriginLab blog post for an overview).
- Start with a worksheet that you want to insert to graph or layout. Add data of interest -- but no more -- to the worksheet, as all rows with data will be inserted.
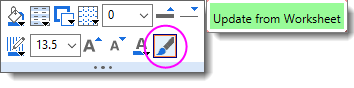
- You can work on styling the sheet before or after you insert the worksheet to graph or layout. Since the inserted worksheet is linked to the original, any changes to the original can be passed to the inserted sheet by (a) selecting it, then (b) clicking the Update from Worksheet button on the Mini Toolbar.
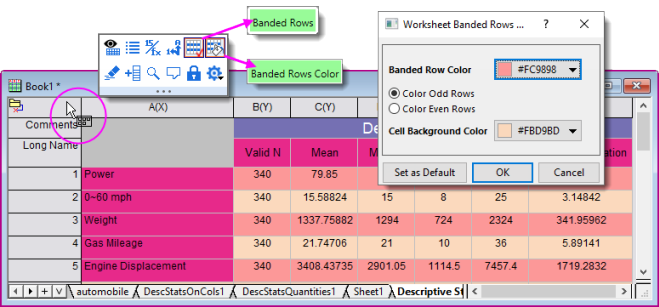
 - One style option that is best applied to the original worksheet is the application of color banding to rows. The Banded Rows button is located on the workbook's page-level Mini Toolbar (hint: hover in the upper-leftmost cell or near the window title in the gray area just to the right of the last column).
- To insert the worksheet to graph or layout, click the Insert Worksheet button (Tools toolbar). From the main menu, choose Insert Worksheet. These actions open a Sheet Browser. The most-recently active sheet will be bolded in the right-hand panel. Pick a sheet in this panel and click OK.
- Drag selection handles on the inserted sheet to rescale it.
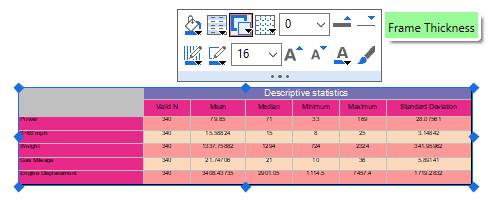
- Select the inserted sheet and use the available Mini Toolbar buttons to add or change gridlines, add a frame, change font size, etc.
Insert worksheet data:
- Select your worksheet cells, then right-click and Copy.
- Go to your graph, right-click and choose Paste, Paste Link (dynamically links table to results), or Paste Link Transpose (dynamically links table and transposes data).
- Copying and pasting a range of data does not allow simultaneous copying of column label row information. If you want to copy them, first double click the table to open the intermediate table. Turn on column label rows in the table and copy paste or paste link metadata from worksheet to table. Then click Update Table button.
Insert a blank table and add data manually or copy/paste or paste link worksheet data:
- Choose Insert: Table menu. Alternatively, click the New Link Table button on the Graph toolbar.
- Specify number of columns and rows in the dialog that opens. Click OK.
- To add data, double-click on the table object. This opens a Table worksheet where you can input values and Update Table. Inputted values can link to cells containing results from fitting and other analysis report tables.
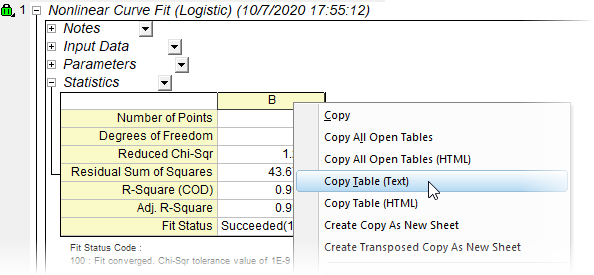
Insert Analysis Report Sheet Tables:
- Go to your Analysis Report Sheet, right-click on any report table heading (e.g. Notes, Statistics, Parameters, etc.) and choose Copy Table(Text) from the context menu.
- Go to your graph, right-click and choose Paste, Paste Link (dynamically links table to results), or Paste Link Transpose (dynamically links table and transposes data).
Note: You can also paste a range of data from report tables, although pasting limited ranges will not bring over header information.
See Also Insert Tables in Graph.
Add a report table of analysis results
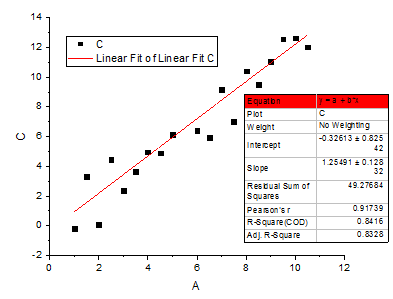
Most of Origin's analysis tools support adding a report table to plots of analysis results (e.g. the Linear Fit tool, Output tab). When adding a report table, the user can customize table content by opening the Quantities in Table dialog and adding, removing, or rearranging quantities. Style the table according to instructions in the next section.
Styling Tables
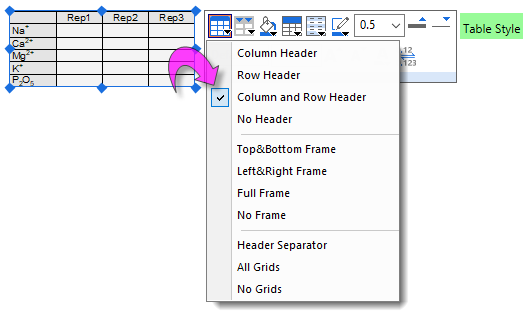
- Alternately, you double-click on the table and open the table in a popup window. In the popup, use the Style and Format toolbars to style your table (some Mini Toolbar buttons will also be available depending on what is highlighted in the popup window). In addition, shortcut menus give you access to Format Cells, Set Data Styles and other useful functions. When you have made your changes in the popup, be sure to click the Update Table button to apply your changes and return to the graph or layout window.
Keywords:analysis, result, publish, grid, link, parameter, metadata
|