1.38 FAQ-154 How do I customize the default axis titles and Legend?Customize-AxisTitle
Last Update: 10/24/2024
There are several ways to customize text in graph axis titles or legends, but the best solution is generally to make use of worksheet metadata -- often, but not limited to, column label row data -- as we have done in the following example.

By default, the Line graph template used to make this graph, is configured to use the following label row data:
- The X axis title is formed from the X column Long Name + Units or "Time(sec)".
- The Y axis title is formed from the Y column Long Name + Units, or "Delta Temperature(°K)".
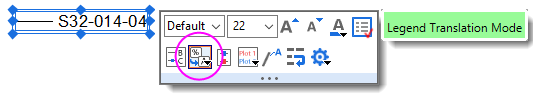
- The graph legend entry is formed from the Y column Comments, or "S32-014-04".
When the default template settings aren't satisfactory you can modify them, with the option of saving your customizations to a graph template. Consider the following:
- Graph axis titles and legends use LabTalk substitution to generate text from project variables.
- The default X axis title for 2D graphs uses a notation of %(?X); the Y axis title uses a notation of %(?Y). This notation is linked to the source column name (Long Name when available, otherwise Short Name) and can be combined with label row Units by going to Plot Details > Legends/Titles tab and checking the box Show Units (when available)... (see Customizing Display of Units in Axis Title, below).
- The default legend text can be modified by going to the Plot Details > Legends/Titles tab and changing the Translation mode of %(1), %(2) drop-down to use other label row data, including "Custom". Beginning with Origin 2021, you can click on the legend object and use the Mini Toolbar's Legend Translation Mode button to choose the label row source.
.
Hard-coding Axis Title and Legend Text
In some situations, you may opt for direct entry of axis title or legend text. This may even be necessary if your data files do not contain useful metadata.
- Double-click on the axis title or legend text and overwrite the existing variable notation with your literal text. In-place editing of legend text is cumbersome and so as an alternative, you can edit text in the legend's Properties dialog.
- As with axis title and legend texts that incorporate worksheet metadata, "hard-coded" text can be saved with the template.
Customize Default Axis Title and Legend by Origin.ini File
Yet another option for customizing axis title and legend text, is to edit the Origin.ini file in your User Files Folder.
- Close Origin.
- Find Origin.ini file located in your User Files Folder (typically at C:\Users\user\Documents\OriginLab\User Files; if you don't find it there, you'll need to run Origin, open the Script Window (Window: Script Window), type "
%Y=" and press Enter).
- Open the Origin.ini file in a text editor (e.g. Notepad) and find the [Text] section.
- Find the corresponding XTitle=, YTitle= and Legend= line to customize the part after =. It can be any text, including those that contain LabTalk substitutions notations. Note: ; Make sure ; is removed before XTitle=, Y=Title= and Legend= if you want to customize it.
For example, if the [Text] section of origin.ini contains the following:
[Text]
;Use workbook long name for default legend
Legend=\L(%d) %%(%d,@WL)\r\n

;The default X axis title is the long name
;of the first independent dataset
XTitle=%%(1X, @LL)
;The default Y axis title is the long name + unit
;of the first dependent dataset
YTitle=%%(1Y, @LG)
Creating a default scatter plot from column B in the workbook shown in the following screenshot will yield the graph to its right:
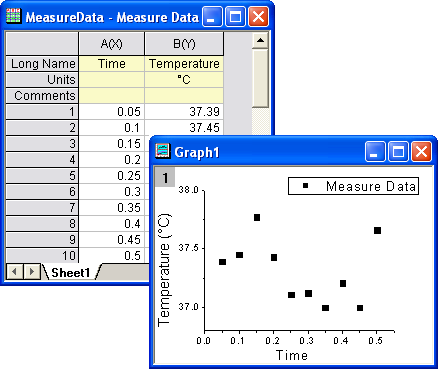
Note that the Long Name of the workbook is "Measured Data". It is displayed in the legend box. The Long Name of the X column ("Time") is used for the X axis title. The Y axis title is the Long Name ("Temperature") and the Units ("oC") of the Y column.
To display both plot's Y and X information in legend, change Legend line to be
Legend=\L(%d) %%(%dY, @LL)(%%(%dX, @LL))\r\n
Customizing Display of Units in Axis Title
This applies to Origin 2016 and newer versions.
To change the way that Units are displayed in the axis title:
- From the Origin menu, choose Preference:Options.
- In the Options dialog, click the Axis tab, then next to the Unit Display for Axis Title box, click the menu button and choose the desired display option (e.g. /<U> for Long Name / Units in place of Long Name (Units)).
Keywords:options, unit display, axis title, substitution notation, string substitution, special characters, graph template, escape sequences
|