1.263 FAQ-1065 How to label each line plot with a legend-type entry?label-line-plot-legend-entry
Last Update: 10/12/2021
In some situations, you might prefer labeling individual line plots with a legend-style entry, rather than having a standard legend.

Beginning with Origin 2021, this is very easy:
- Select the standard legend object.
- Click the Attach to Plots button on the Mini Toolbar that pops up.
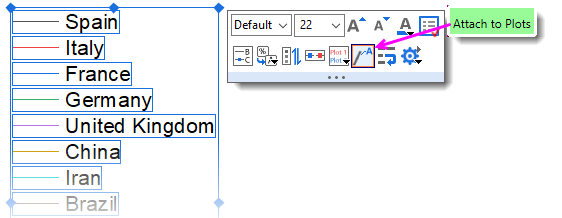
- Select the standard legend object and press Delete.
 | To nudge overlapping labels, press the Ctrl key and drag with your mouse.
|
Version 2020b and Earlier:
- Choose Format: Plot to open Plot Details, then click the Label tab in the right panel.
- Set controls as in the following screenshot and set other controls as needed:
-
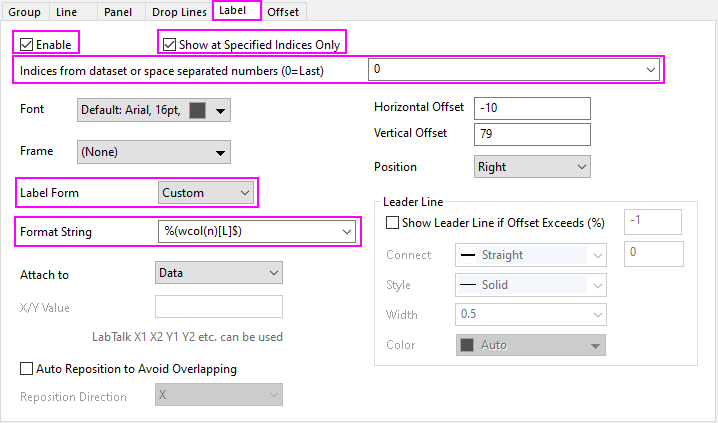
In this case, we are using the custom Format String %(wcol(n)[L]$) that labels the last point of each plot with the dataset Long Name, using Substitution Notation. Use of other plot metadata -- Units, Comments, etc. -- is certainly possible.
Keywords:plot label, data label, legend, line plot, line graph, Attach to Plots, substitution notation
|