1.247 FAQ-1038 How can I make an "L-shaped" leader line for my data labels?L-shaped-leader-line
Last Update: 2/5/2020
Leader lines are used to connect a data label and plot symbol. They allow you the flexibility to nudge data labels around to prevent overlap or over-crowding of labels.
Origin has several leader line connection styles including Polyline-Horz, Polyline-Vert, Step-Horz and Step-Vert and how these connection styles work, is documented here.
What may not be intuitive is how to create an "L-shaped" leader line and to do that, you do the following:
- Double-click on the plot to open Plot Details.
- Click on the Label tab to the right side of the dialog.
- In the Leader Line group, set Connect = Step-Horz and enter 0 in the accompanying text box.
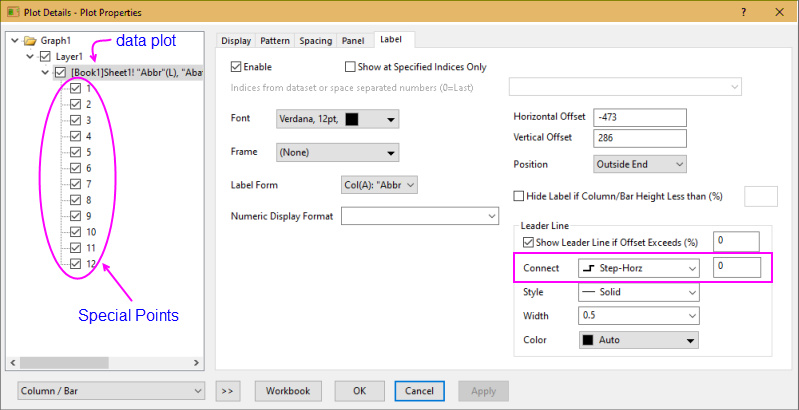
- Note that you can set leader lines globally for all data labels attached to a given plot. When doing so, all "special points" will register as Connect = Auto.
- This does not prevent you from choosing a different connection style for any given special point. Simply highlight a special point in the list below the data plot in the left panel of Plot Details and choose another Connect option for that particular point.
The bottom line is that by setting one or more labels as special points, you can have "L-shaped" connections for some data labels, straight connections for some, and polyline-vertical for others.
Keywords:connecting line, special point, Polyline-Horz, Polyline-Vert, Step-Horz, Step-Vert, offset, overlap, crowded
|