1.67 FAQ-191 How to customize a single data point in the scatter plot?Customize-Single-Data-Point
Last Update: 3/10/2021
You can modify the display properties of a single data point, even if it is part of a data plot group. This point-by-point control is limited to plot types such as line, symbol, line+symbol, column/bar and box.
To modify the display of a single data point,
- CTRL + click on the data point. Use the Mini Toolbar, or Style and Format toolbar buttons, to customize the point. Mini Toolbar provides more perperties customization, including adding lable for a single point, and modifying error bar appearance.
- CTRL + double-click on the data point. This opens the Plot Details dialog box for you to modify all properties of this particular point.
- CTRL + click on the data point. Then right-click and select Edit Point from the short-cut menu. This opens the Plot Details dialog for this particular point.
The following graphic demonstrates editing point properties using Plot Details:
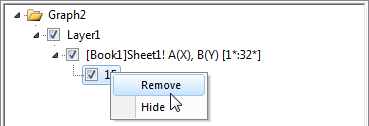
To remove an existing special point,
Open Plot Details dialog. Right-click on the data point at the left panel, and select Remove from the context menu.
 | Beginning with Origin 2018, you can automatically add special points to the graph legend by Ctrl+L hotkey or right-clicking on the legend and choosing Legend: Reconstruct Legend.
|
| Adding a special point at the beginning or end of a plot is not always easy, as for instance with a line plot of many data points. However there is a simple, foolproof technique:
- Select a special point anywhere on the plot, then double-click on the point to open Plot Details.
- In the left-hand panel of Plot Details, click once on on the point index number and wait until the index number becomes editable.
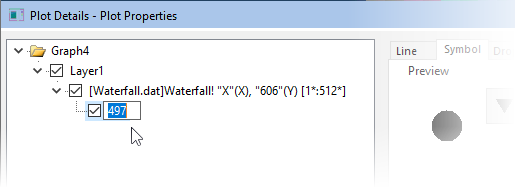
- To add the special point to the first point in the plot, type Begin; to add to the last point type End. If you know the index number of the first or last point, you can type that instead.
- Click outside the edit box. Make other special point customizations as needed, the click Apply or click OK to close Plot Details. The special point will be added to the beginning or end of your plot.
|
Keywords:single data point, symbol, scatter, mark, delete a point, remove a special point
|