PURPOSE
This tool can be used to perform linear regression with categorical or continuous independent variables. And it can also be used for ANCOVA by creating dummy variables for categorical independent variables. Features include:
- Support custom model with interaction terms.
- Use calculated coefficients for predictions.
- Output effects test result to determine which effects are significant.
- Create fitted plot and diagnostic graphs.
INSTALLATION
Download the file GLR.opx, and then drag-and-drop onto the Origin workspace. An icon will appear in the Apps Gallery window.
NOTE: This tool requires OriginPro.
REQUIRE PACKAGES
This app requires orgutils app.
OPERATION
- Click the General Linear Regression icon in the Apps Gallery window to open the dialog.
- In the Input tab, choose a column for Dependent Variable, and columns for Continuous and Categorical Independent Variables.
Either Continuous or Categorical can be empty, but they can't both be empty.
If Categorical data is chosen, Reference Factor Level for each column can be specified.
- In the Settings tab, Model Type provides two options: Main Effects and Custom Model.
If Custom Model is chosen, you can add any main effects and interaction terms to the model in the opened dialog. You can also modify the model by clicking the button on the right of Model box. Include Intercept option specifies whether to include the intercept parameter in the regression. Coding Type is used to define the coding scheme for categorical independent variables. Type (1, 0) estimates the difference between each level mean and the reference level's mean while (-1, 0, 1) estimates the difference between each level mean and the overall mean.
- In the Quantities tab, check options to control which results to output in the report sheet, including Fit Parameters (Standard Error, Confidence Limits, t-Value and Prob>|t|), Fit Statistics (Residual Sum of Squares, Reduced Chi-Sqr, R Value, R-Square and Adj. R-Square) and Effect Tests.
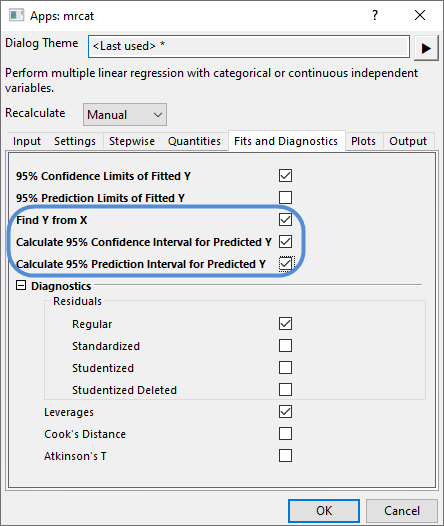
- In the Fits and Diagnostics tab, specify whether to output Confidence Limits of Fitted Y, Residuals (Regular, Standardized, Studentized and Studentized Deleted) and Influence (Leverages, Cook's Distance and Atkinson's T).
- In Plots tab, specify whether to create Fitted Plot and Residual Plot. Residual plot is a four-panel graph including residual vs row order plot, histogram of residual, residual vs fitted Y plot and P-P plot for residual. And Residual Type can be specified.
- Click OK button, a report sheet, a report data sheet and a plot data sheet will be created.
NOTES
- If a row in input data contains one or more missing values, the entire row will be excluded from the analysis.
- Only the entire column is supported for input data.
- Data Filter is not supported in the analysis.
In v1.53, more features are supported in the app. Major new features include:
- Find Y from X
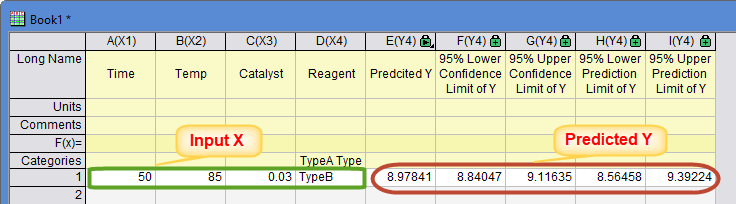
Check Find Y from X check box in General Linear Regression dialog's Fits and Diagnostics tab.
In the created FindYfromX sheet, type values for independent variables at which to predict, predicted y values will be calculated automatically.
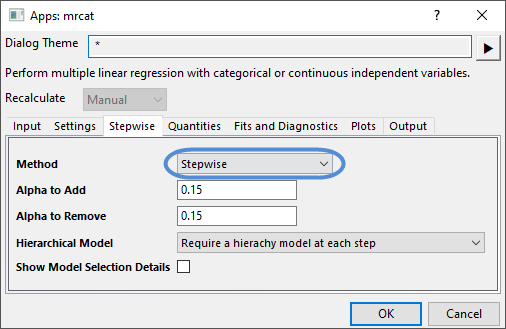
- Stepwise
In General Linear Regression dialog's Stepwise tab, select a method to define how to fit the model (four options are available: None, Stepwise, Forward Selection, Backward Elimination).
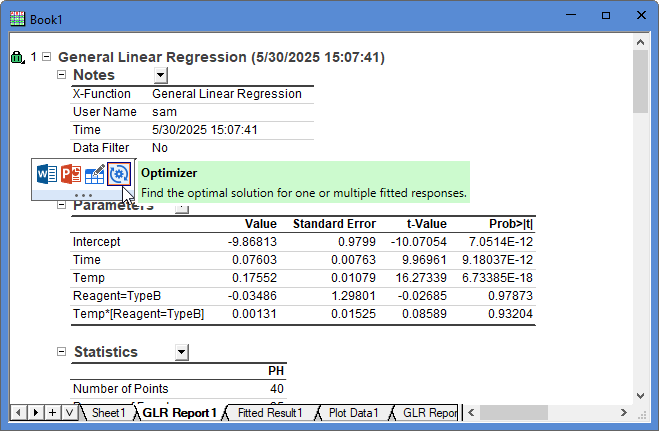
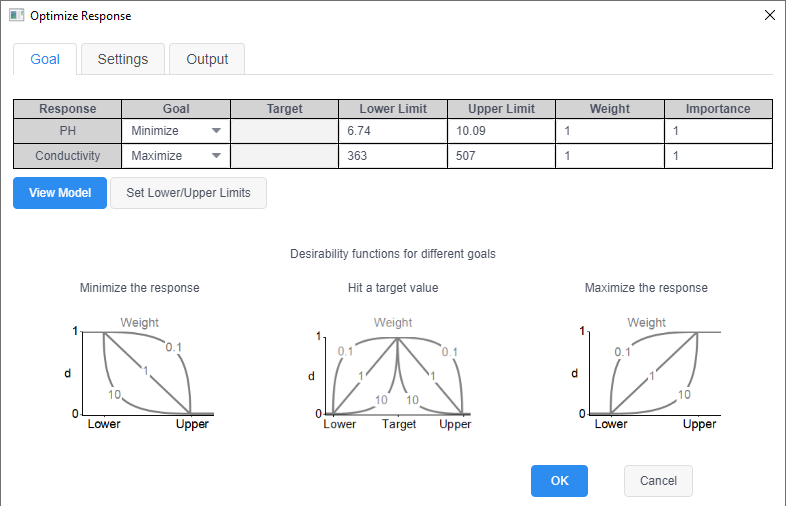
- Optimizer
This feature requires at least Origin 2025b. Perform General Linear Regression, and choose Manual or Auto from Recalculate dropdown list, and make the generated report active, click on the edge of the report. In the opened mini toolbar, click Optimizer button, and it will open the Optimizer dialog.