PURPOSE
This app can be used to:
- Open a workbook template with CIE 1931 color space chromaticity diagram and CIE 1976 UCS (uniform chromaticity scale) diagram.
- Calculate CIE XYZ from photoluminescence spectra and add PL data to the chromaticity diagram.
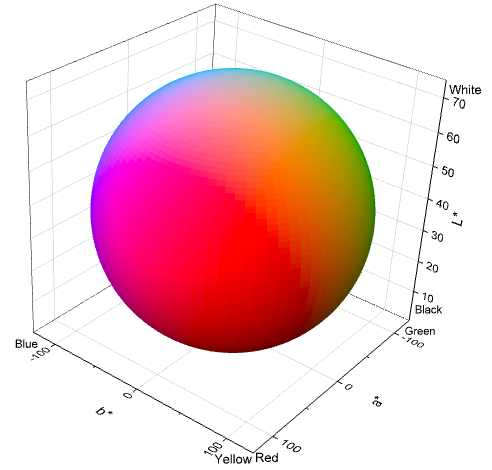
- Plot L*a*b* data in 2D, 2D Polar, 3D and convert L*a*b* data to CIE 1931 xyY, CIE 1976 UCS (u', v').
- Convert XYZ to L*a*b*, XYZ to RGB, xyY to XYZ, RGB to XYZ, RGB to L*a*b*, and RGB to u'v'.
INSTALLATION
Download ChromaticityDiagram.opx file, and then drag-and-drop onto the Origin workspace. An icon will appear in the Apps Gallery window.
OPERATION
With a worksheet or a graph active, click the app icon. A toolbar with three buttons will appear.
- Open Chromaticity Diagram Template
Click the first button, and it will open a workbook template. In the third sheet, two graph templates (CIE 1931 and CIE 1976) are inserted. Open the graph window by double clicking on the worksheet's cell. If you want to show color temperature in CIE 1931, click Show/Hide Color Temperature button on the bottom right of the graph. You can also add your own data to the graph template.
- Chromaticity Diagram with PL
- Click the second button, and it will open the PL2CIE dialog.
- Choose Phtoluminescence Spectra (PL spectra) from the worksheet or the active graph. You can choose multiple PL spectra, and each PL spectrum corresponds to a point in the chromaticity diagram.
- In Settings branch, select Spectral Type, two types are available: Radiance and Reflectance or Transmittance (0-1). The latter requires input to be between 0 and 1. For the latter, select Spectral Power Distribution of Illuminant, four options are available, A, D50, D65 and Custom, for the custom type, user should replace PL sheet's column M with his actual SPD data in the app folder's Chromaticity.ogwu file. Select Standard Observer: CIE 1931 2° or CIE 1964 10°, which defines the color matching function.
- In Graph branch, select CIE type for the diagram. Two options are available: CIE 1931 and CIE 1976. Choose plot type (Scatter or Line+Symbol) and determine whether to show spectrum labels in the graph.
- Click OK button. A chromaticity diagram with points for PL data will be created. If you want to show color temperature in CIE 1931, click Show/Hide Color Temperature button on the bottom right of the graph. Workbook data for the graph will be hidden. You can activate the workbook in Project Explorer.
- L*a*b* Plot
Click the third L*a*b* Plot button, a dialog will be opened and ask the user to choose a goal. Four options are available: Following graphs can be created using these options.
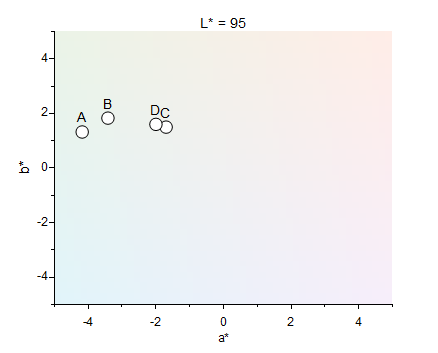 2D Scatter
|
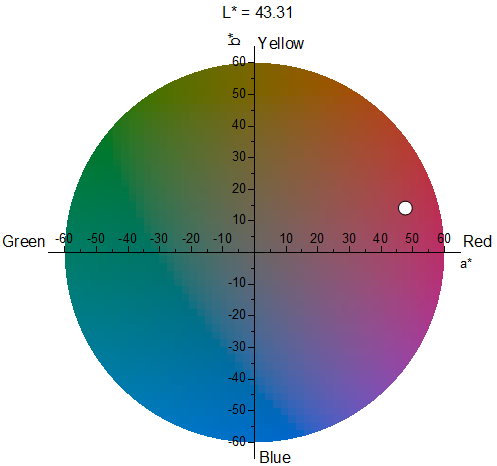 2D Polar Scatter
|
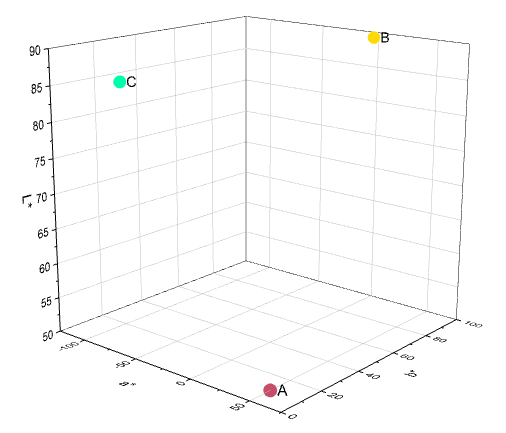 3D Scatter
|
 3D Ellipsoid with Sections
|
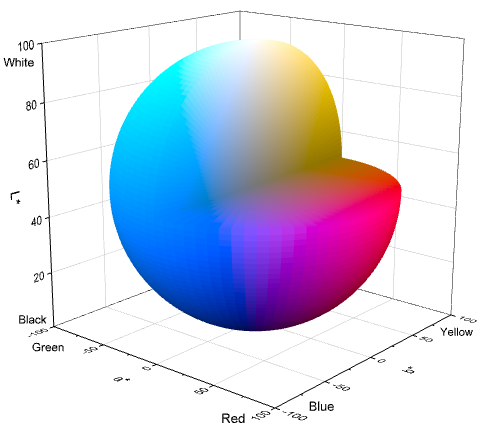
 3D Full Ellipsoid
|
To see how to create above graphs using the app, right-click the app icon in Apps Gallery window, choose Show Samples Folder from the short-cut menu. Open LABDoc.opju project file.
- 2D Scatter Plot
- 2D Polar Plot (In Origin 2024b or older versions (minimum version 2022), it will open a project file for graph template, and open a dialog in higher versions.)
- 3D Scatter Plot
- 3D Ellipsoid Plot
- Convert CIE 1976 L*a*b* to CIE 1931 xyY, CIE 1976 UCS (u', v')
- Converter
Click the fourth Converter button, the converter template will open. It supports to convert XYZ to L*a*b*, XYZ to RGB and xyY to XYZ in FromXYZ sheet, and RGB to XYZ, RGB to L*a*b*, and RGB to u'v' in FromRGB sheet.
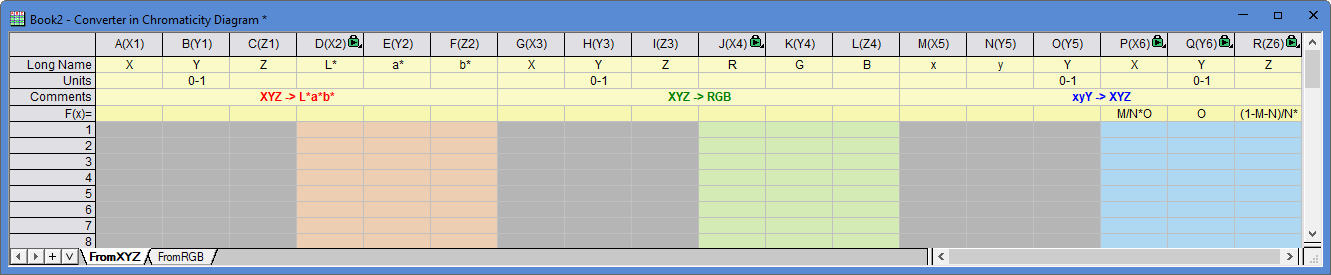
Type XYZ values in columns A, B and C, L*a*b* values in columns D, E and F will be calculated automatically. Columns J, K, L and P, Q, R works in the same way.
ALGORITHM
- Chromaticity Diagram with PL
- Radiance Spectra
\(X=\int f(\lambda) \bar{x}(\lambda) d\lambda\), \(Y=\int f(\lambda) \bar{y}(\lambda) d\lambda\), \(Z=\int f(\lambda) \bar{z}(\lambda) d\lambda\)
where \(f(\lambda)\) is the spectra, \(\bar{x}(\lambda)\), \(\bar{y}(\lambda)\) and \(\bar{z}(\lambda)\) are CIE's color matching functions.
- Reflectance or Transmittance Spectra
\(X=\frac{1}{N}\int S(\lambda) I(\lambda) \bar{x}(\lambda) d\lambda\), \(Y=\frac{1}{N}\int S(\lambda) I(\lambda) \bar{y}(\lambda) d\lambda\), \(Z=\frac{1}{N}\int S(\lambda) I(\lambda) \bar{z}(\lambda) d\lambda\)
where \(S(\lambda)\) is the spectra, \(I(\lambda)\) is the spectral power distribution of the illuminant, \(\bar{x}(\lambda)\), \(\bar{y}(\lambda)\) and \(\bar{z}(\lambda)\) are CIE's color matching functions. And \(N=\int I(\lambda) \bar{y}(\lambda) d\lambda\).
REFERENCE
- CIE 1931, CIE 1976, CIE L*a*b
- Standard illuminant, Illuminant D65
- Colorimetric Tables, Spectral Calculator Spreadsheets
NOTE
- PL spectrum's x data represents wavelength, and the units must be nm.
- In L*a*b* Plot, reference white point is D65, and color space is sRGB.