1.52 FAQ-171 How to plot function plotsPlot-Functions
Last Update: 9/4/2019
Create a New Function Plot
Origin supports plotting 4 kinds of functions, 2D functions, 2D parametric functions, 3D functions and 3D parametric functions.
- Click File: New: Function Plot
or
- Click on a function plot button on the Standard toolbar.
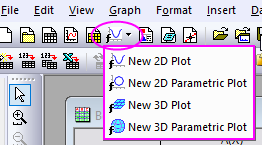
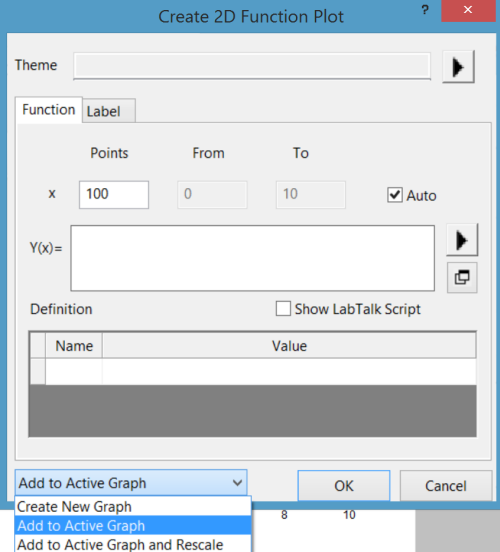
When you have selected a function plot from the menu, a dialog will open to allow you to define the function.
To plot 3D parametric function, you can select File: New: Function Plot: 3D Parametric Function Plot menu to open the Create 3D Parametric Function Plot dialog. In this dialog, enter the Mesh Grid, set the Scale for two parameters, enter the parametric equations for the X, Y and Z variable, and then define the constants which can be used in function definition in the bottom table if needed. Click OK to get the graph. See more [3D function samples]
| Note: After you plot a function, you can redefine or customize the function plot in the Function tab of Plot Details dialog which can be opened by double-clicking the function plot on graph window.
|
Add Function Plot to an Existing Graph
- With the graph window active, click File: New: Function Plot or click on a function plot button on the Standard toolbar, as outlined above.
- Choose Add to Active Graph in the drop-down list at the bottom of the dialog box.
Note: If you choose 3D Function plot while the active graph window is 2D, this drop-down list will not show.
Alternate Method of Adding Function Plot to an Existing Graph
- With the graph active, click Insert: Function Plot or Insert: Parametric Plot.
Note: In older versions, this is found under Graph: Add Function Plot.
Keywords:Plot Mathematical Functions, 3D Parametric Function Plot, 2D Parametric Function Plot, Function Plot, Mesh Grid
Minimum Origin Version Required: 9.0SR0
|