1.189 FAQ-889 How to add asymmetric error bars for your 2D or 3D plot?Asymmetric-ErrorBars
Last Update: 3/4/2020
Sometimes, you might need add asymmetric error bars on your 2D or 3D plot. Here, asymmetric error bars means the plus and minus error bars are different in length and from two different dataset.
For 2D plot, with XY(yEr+)(yEr-) worksheet data, you can follow the steps below to add asymmetric error bars on Y direction:
- Set last two columns as Y Error. And then, highlight all columns to plot a line/scatter/line+scatter graph.
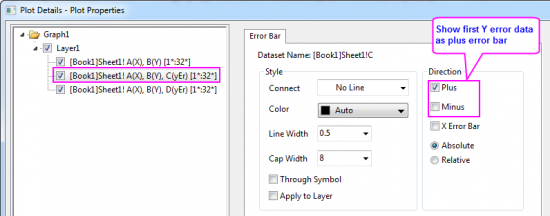
- Double-click on the plot to open the Plot Details dialog. Select the second plot and third plot respectively on left panel, go to Error Bar tab on the right panel to deselect the direction you don't want to show only one-side error bar for each plot.
For 3D plot, with a matrixsheet (with three objects and last two objects are error data) or XYZ(zEr+)(zEr-) worksheet data, you are not able to plot two error data on the plot at same time as 2D plot did, but you can try the workaround below to add asymmetric error bars on Z direction.
Please note,
- For matrix data, you can only plot 3D plot with error bars on Z direction.
- For worksheet data, you can create 3D plot with error bars on any direction(X,Y and Z).
|
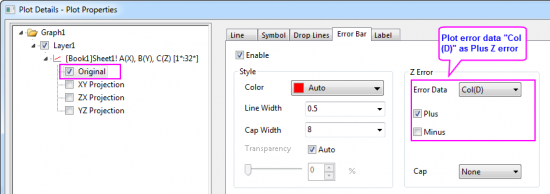
- With the first matrix object or XYZ(zEr+) data highlighted, select Plot> 3D: Line+Symbol : 3D Scatter + Error Bar menu to create a 3D scatter plot with symmetric Z error bars.
- Double-click on the plot to open the Plot Details dialog. Select Original level, go to Error Bar tab on the right panel, turn off Minus for Error/Z Error.
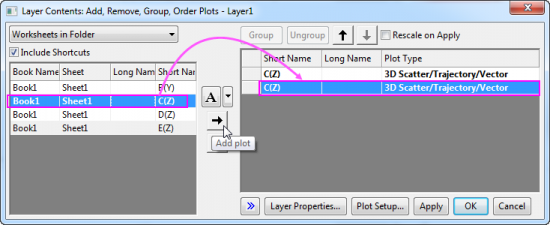
- Select Graph: Layer Contents menu to open Layer Contents dialog, add first matrix object or col(C) as 3D scatter plot into the 3D graph again.
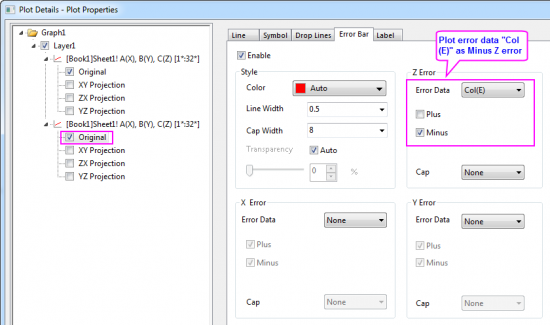
- Double-click on the plot to open the Plot Details dialog again. Select the Original level of second plot, go to Error Bar tab, select Mat(3) or Col(E)(data "zEr-" in forth column) as Error Data and turn off Plus for Error/Z Error.
- As we plotted the same matrix object/XYZ data as 3D scatter twice into same graph layer, you might need preform some settings to make these two plots overlapped totally so that it looks like only one plot there.
Keywords:asymmetric error, error bars, plus error, minus error
|