1.251 FAQ-1044 Can I specify an anchor point which the middle color is mapped to and ticks must pass through?Colormap-Anchor-Point
Last Update: 4/15/2020
In a 3-Color Limited Mixing Colormap graph, if you want to set a special "anchor" point in the mapped color range, to which the middle color must be mapped, and the tick label must be shown at this value, please follow steps below.
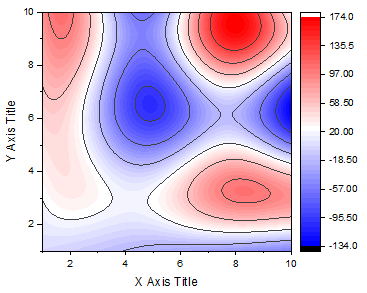
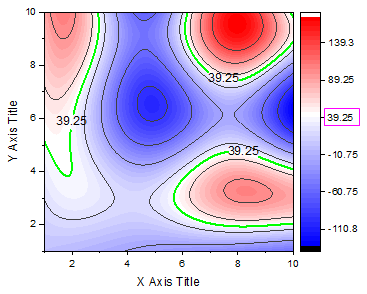
For example, left color-fill contour is created from a default template. The middle color, white color is located at Z value = 20, which is the median value of Z range. We want to shift the middle color to 39.25 (not a major level), and show "39.25" in the Color Scale thus all ticks will be recalculated and repositioned according to this anchor.
|
|
| Default Color-fill Contour
|
Anchor at Z = 39.25
|
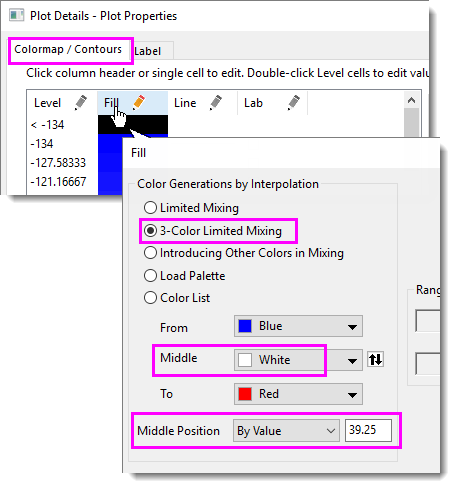
To anchor the middle color at a value=
- Double click on the plot to open Plot Details dialog. On the Colormap/Contours tab, click on Fill color header to open Fill dialog.
- Set Middle Position to By Value and enter the value.
Note: this option is also available for Worksheet Conditional Format: Heatmap.
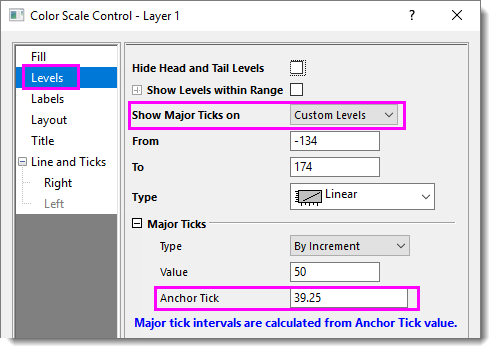
To show the Anchor Tick in Color Scale
- Double click on the Color Sale to open Color Scale Control dialog.
- On the Levels page, set Show Major Ticks on to Custom Levels, and enter value to Anchor Tick under Major Ticks branch.
Note: this option is available for all kinds of colormpped graphs, not limited to 3-Color Limited Mixing kind.
Keywords:colormap, contour, color scale, dock at special value, anchor point, pass though a value
|