1.244 FAQ-1032 Density Scatter Plot Validationdensity-dots-validation
Last Update: 11/18/2024
Density Dots is scatter plots to show data density, where the points are color-mapped to the data density. The density is computed using Kernel Density Estimate
To calculate Kernel Density Estimate, Origin uses a fast algorithm that utilizes 2D binned approximation and 2D interpolation. First 2D binning is performed on the (x, y) points to obtain a matrix with the bin counts. Then 2D Fast Fourier Transform is utilized to perform discrete convolutions for calculating density values of each grid. 4th root of density values is calculated to map the density scale to the color scale
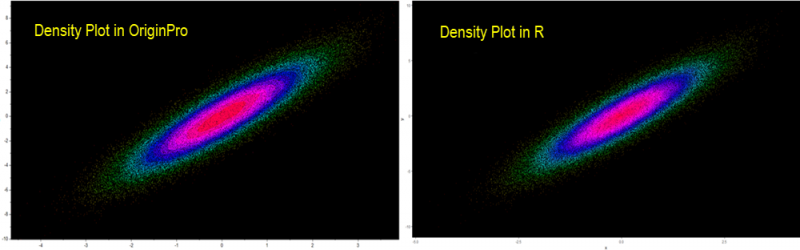
Origin can generate similar result to R from the same dataset
Comparison of R and Origin Results
Reference
Data:
1 Response Variable (y), 1 Predictor Variable (x)
100000 Observations
Generated Data
Data File: DP.csv
Origin Project File: density_dots_validation_sample.opju
R Codes to Generate the Graph
xx= read.csv("DP.csv",header=FALSE)
as.list(body(smoothScatter))
trace("smoothScatter",quote(browser()),at=19)

w<-c(0.056990976577602, 0.13442535086237)
smoothScatter(xx, nrpoints = 0,nbin=151,bandwidth=w)

#Debug and run following script
#Type "n" to enter line 19
stopifnot((nx <- length(xm)) == nrow(dens),
		  (ny <- length(ym)) == ncol(dens))
ixm <- 1L + as.integer((nx-1)*(x[,1]-xm[1])/(xm[nx]-xm[1]))
iym <- 1L + as.integer((ny-1)*(x[,2]-ym[1])/(ym[ny]-ym[1]))

z<-dens[cbind(ixm, iym)]
df<-data.frame(x=x[,1],y=x[,2],z=z)

library(ggplot2)
sp<-ggplot(df, aes(x,y,colour=z)) +  geom_point(shape=".") +
	theme(panel.background = element_rect(fill = 'black'),
	panel.grid.major = element_blank(),
	panel.grid.minor = element_blank(),
	panel.border = element_blank())
sp
cval<-seq(0,1,length.out=6)
sp+scale_color_gradientn(values = cval,colours = rainbow(20))
Keywords:validation, compare to R
|