15.5.1 Custom Table Style Template and Quantities in TableFitRef-CustomReportTable
When fitting from a graph window, you can decide whether or not to paste result tables to the source graph as well as customize the table format by specifying a worksheet template in Table Style Template, or customize the table content by dialog or specifying a .INI file in Quantities in Table.
Table Style Template
The report table is created by a built-in workbook template. Similar to manipulating a regular worksheet, you can customize the worksheet styles like fonts, background color, etc, and save this worksheet as a template, and then specify this template on Template to Create Table edit box.
Example:
- Import the file \Samples\Curve Fitting\Linear Fit.dat, highlight column B and plot a scatter plot.
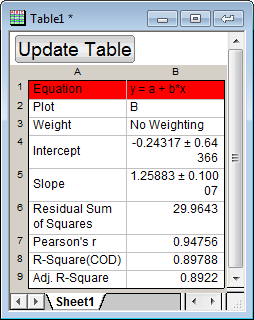
- With the graph page active, select Analysis: Fitting: Linear Fit to bring up the Linear Fit dialog. Accept the default settings and click the OK button. The result table is pasted on source graph.
- Double-click the table to open it in a worksheet window. Set the first row's background color to red.
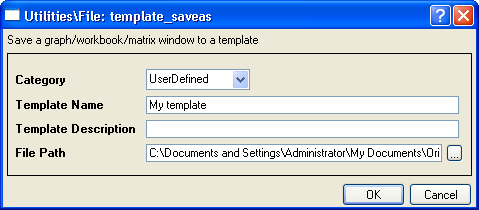
- Select File: Save Template As from the Origin menu. Name it as MyTemplate, and save it.
- Go back to the raw data worksheet. Highlight column C and create a scatter plot.
- With the graph active, bring up the Linear Fit dialog again. On Output tab, Expand Graph: Show Result Table to Source Graph branch, enter "MyTemplate" in the Table Style Template edit box.
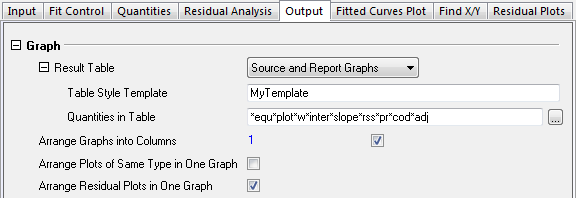
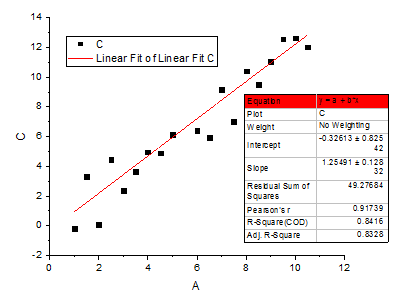
- Click the OK button to fit. You can see the first row of report table in the result graph is red. In other words, the user-defined template was used to create the table on the graph.
Quantities in Table
There are two ways to determine what items show in the graph window results table:
 | In earlier versions, the report table displayed Standard Error in a separate table column. To revert to the older style delete all entries in the Quantities in Table dialog and press OK. See this FAQ for more information.
|
Quantities in Table dialog
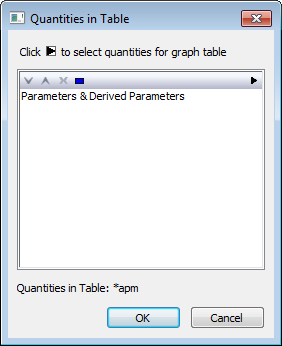
- The Quantities in Table dialog can be opened in two ways: (1) Before fitting, open by clicking the
 button next to Quantities in Table (e.g. under Graph on the Output tab of the Linear Fit dialog); or (2) after the graph and table are created, by right-clicking on the result table in the graph window and choosing Quantities in Table. button next to Quantities in Table (e.g. under Graph on the Output tab of the Linear Fit dialog); or (2) after the graph and table are created, by right-clicking on the result table in the graph window and choosing Quantities in Table.
- Use the Quantities in Table dialog to select, remove or reorder quantities using the controls at the top of the list.
- Click the arrow to open a flyout menu and to include additional quantities.
- Additionally, you can Reset the table to the default configuration.
- Clicking OK will add the selected quantities to the table.
The following tutorial introduces the steps of creating linear regression report table on graph.

|
- Start with a new workbook and import the file \Samples\Curve Fitting\Linear Fit.dat.
- Click and select the second column and use the menu item Plot: Symbol: Scatter to create a scatter plot.
- With the graph active, use the menu item Analysis: Fitting: Linear Fit... to bring up the Linear Fit dialog.
- On the Fit Control tab, clear the Apparent Fit check box.
- On the Output tab in the dialog, expand Graph > Result Table node. Click the button next to the Quantities in Table to open the Quantities in Table dialog. Press CTRL and click to select Equation, Plot, Weight, Residual Sum of Square, R-Square(COD) in the list. Click
 to remove. Click OK and The remaining quantities will be shown in the graph. to remove. Click OK and The remaining quantities will be shown in the graph.
- Click OK to close the Linear Fit dialog, the result graph will be similar to graph below:
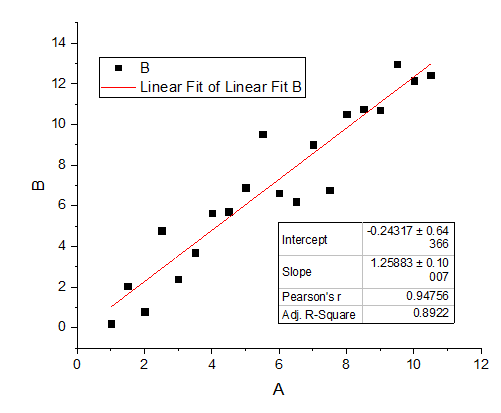
|
Custom Quantities in Table by editing INI file
Origin uses themes, which save as .INI files in \CustomTable folder, to specify the table content. If you want to create a new theme, you should make a new .INI file, save in the \CustomTable folder and specify this .INI file on Quantities in Table edit box.
How to indicate a report tree value
The content in report tables is just links to the report worksheet, and the report worksheets are organized by tree structure, so you can just specify the tree nodes on the .INI file by:
- TableName!ColumnNodeName[RowNodeName]
For example, the following curve slope value can be written as:
- Parameters!Value[Slope]
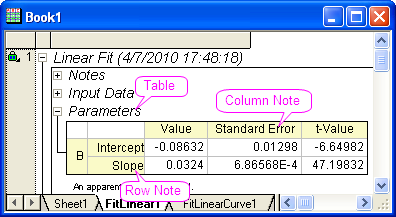
Note that the node names are some what different from what you see in report worksheet, please refer to the following node item names.
Node item names
Notes table (Notes)
| Column/Row
|
Item Name
|
|
Description
User Name
Operation Time
Model
Equation
Report Status
|
Description
UserName
Time
Model
Equation
AutoUpdateMode
|
Input Data table (Input)
| Column/Row
|
Item Name
|
|
Columns
Rows
|
Cn
Rn
|
(Where n is the nth column / row)
Parameters table (Parameters)
| Column/Row
|
Item Name
|
|
Value
Fixed
Standard Error
t-Value
Prob>|t|
LCL
UCL
Dependency
CI Half-Width
Lower Bound
Upper Bound
|
Value
Fix
Error
tValue
Prob
LCL
UCL
Dependency
ConfInterval
LowerBound
UpperBound
|
Statistics table (RegStats)
| Column/Row
|
Item Name
|
|
Number of Points
Degrees of Freedom
Reduced Chi-Sqr
Residual Sum of Squares
R Value
R-Square(COD)
Adj. R-Square
Root-MSE (SD)
Number of Iterations
Fit Status
|
N
DOF
ReducedChiSq
SSR
Rvalue
RSqCOD
AdjRSq
RMSESD
NumIter
FitStatus
|
Summary table (Summary)
ANOVA table (ANOVAs)
| Column/Row
|
Item Name
|
|
DF
Sum of Squares
Mean Square
F Value
Prob>F
Regression
Residual
Uncorrected Total
Corrected Total
|
DOF
SSq
MeanSq
FValue
PValue
RegressionN
ResidualN
UCTotalN
CTotalN
|
(Notes: N means the nth ANOVA table)
Constructing INI file
- The theme files have a look of standard .INI files: there are sections that start with
- [sectionname]
- line, followed by
- name=value
- entry pairs. For now only one section, with the name [DataLinks], is supported. Lines start with semicolon ";" are comment lines.
- All entries should have names that start with the prefix "Entry", followed by a number. The numbers are used to order the entries in the theme vertically. Note that one entry, when theme is applied to a custom table, may result in more than one row. So, for example, if there are two entries, Enrty1 and Entry2, and Entry1 produced 3 rows in the custom table, then the Entry2 in the custom table will appear starting with row 4.
- Each entry value can consist of zero or more items, separated by space. The items will appear from left to right (i.e. in subsequent columns) when the theme is applied to a custom table. If an entry is empty (i.e. it has zero items) it results in an empty row when the theme is applied.
- Each item can consist of several parts. The parts can be either the node names of a report tree that refer to some other tables, in which case they produce links to other tables, or they can be literal strings which will be put as such in cells when the theme is applied. If there is space in the items, they ought to be quoted.
- If an item is a link, it typically looks like this:
- TableName!ColumnNodeName[RowNodeName]
- Every link item must begin with the name of a node in the report tree that represents a table. RowNodeName represents the name of a node that produces one row in the TableName table (that it represents a row is indicated by the fact that the node name is in square brackets). ColumnNodeName represents the name of a column node in the TableName table. The above link will, when applied as a theme to a custom table, produce the link to one cell: the cell is in the table TableName, in the row RowNodeName, and in the column ColumnNodeName. For example:
- Parameters!Value[P1]
- is a link to the Value of the first parameter in the Parameters table.
- Several column nodes of the same table can be combined in one link. For example:
- Parameters!(Value,Error)[P1]
- will produce two cells side-by-side: the links to the Value and the Error cells of the first parameter in the Parameters table.
- If a row or a column node name is omitted, the result is a link to the "whole" other dimension. For example
- Parameters!Value
- produces the link to the whole Value column, and
- Parameters![P1]
- produces a link to the whole row of the first parameter in the Parameters table.
- If both row and column node names are omitted, and only the table node name (followed by '!') is present, the result is a link to the whole table. Such as:
- Parameters!
- is a link to the whole Parameters table.
- There is a special keyword -- Labels. It is used to indicate that in the given dimension the link to labels should be produced. For example:
- RegStats![Labels]
- produces the columns labels of the table RegStats. And
- Parameters!Labels[P1]
Example
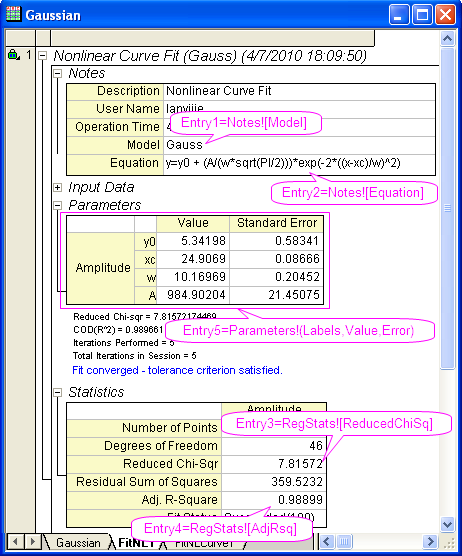
Open the file \CustomTable\FitNL.INI by notepad, you can see the default output table theme for nonlinear curve fitting is (valid lines):
- [DataLinks]
- Entry1=Notes![Model]
Entry2=Notes![Equation]
Entry3=RegStats![ReducedChiSq]
Entry4=RegStats![AdjRsq]
Entry5=Parameters!(Labels,Value,Error)
which represent the following tables on report worksheet:
To involve the p value in ANOVA table to the graph table, just modify the file to:
- [DataLinks]
- Entry1=Notes![Equation]
Entry2=RegStats![AdjRsq]
Entry3="Model P Value" ANOVAs!PValue[Regression1]
Entry4=Parameters!(Labels,Value,Error)
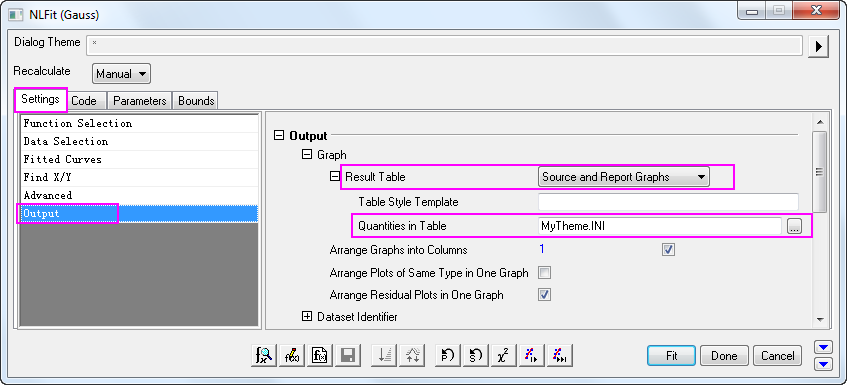
Create a folder named CustomTable in you User File Folder. Origin will use settings (.INI file) in User File Folder first. Then save the .INI file, say MyTheme.INI in the new created CustomTable folder. To use this theme, specify the file (full name) on Output: Settings: Show Result Tables to Source Graph: Quantities in Table edit box.
|