1.257 FAQ-1056 How to customize data label following the display format of axis tick label?Label-Format-follow-Axis
Last Update: 5/21/2020
If you customize the display format of the axis tick labels, for examle, divide labels by a factor, calculate by a formula, or display in scientific notation, and then you add labels to the data points, no matter using the Label tab of Plot Details dialog or the Annotation tool, you may want to use the format to the data labels instead of the original display in the source worksheet.
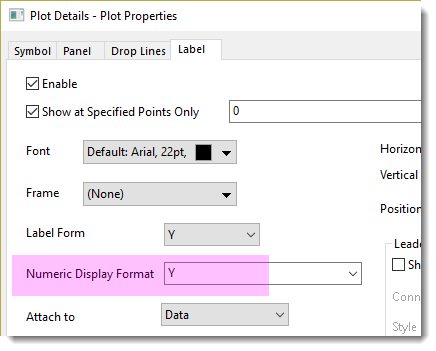
To let data labels follow the Axis Tick Label display, set Numeric Display Format as Y.
- Double-click on the plot to open the Plot Details dialog.
- On the Label tab, specify "Y" to Numeric Dislplay Fromat.
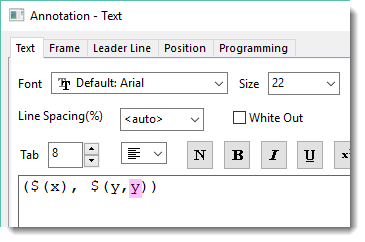
- Right-click on the annotation label and select Properties.
- Specify "y" to lollow Y Axis tick label display.
| Notes:
The precision of axis tick labels is based on the axis increment. For example, if axis increment is day, then precision should be hour, 1 level higher; if increment is minute, precision should be second level, 1 level higher.
In this case, you may want the data labels to follow the precision of axis tick labels,
- Use "xt" to follow the precision of axis major tick label;
- Use "xe" to follow the editing format based on axis major tick labels. That is, for numeric labels, "$(x,xe)" means full precision; for date/time labels, "$(x,xe)" is the same as "$(x, x)".
|
Keywords:label formula, label display format, display settings, tick label settings
|