1.88 FAQ-441 How do I export graphs with exact size and resolution as specified by publishers?Set-ExpGraph-Size-Resolution
Last Update: 1/8/2019
When exporting graphs as image files for inclusion in science or engineering publications, consider the following:
First, find out exactly what the publisher wantsA quick review of popular journals reveals a wide range of requirements. While many prefer to see images embedded in MS Word documents for initial submission, most request that separate image files be submitted for publication. So, you'll need to determine which export formats and sizes are acceptable to your journal.
- If you are submitting raster images (e.g. TIFF, JPEG), you'll need to know the journal's size and resolution/DPI requirements.
- With vector images (e.g. PDF, EPS), image dimensions and the resolution/DPI are not as important since vector images are infinitely rescalable.
- Check font and font size requirements, as many journals have specific requirements for text inside of figures.
- Check lines weights of axes, annotations, etc. as some journals specify minimum line weights.
Once you have determined image format, image dimension and resolution, font and line weight requirements, etc., we recommend that you follow this general outline when preparing your graph for publication:
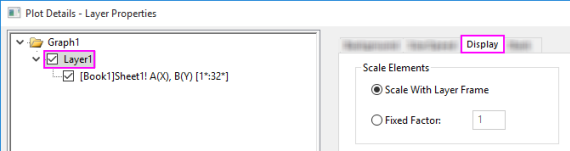
- Fix Scale Factors: The graph layer is a self-contained unit consisting of a set of axes and one or more plots, along with associated legend object, text objects, etc. When you change the size of a graph layer either by (a) dragging resizing handles on the layer frame or (b) changing layer dimensions in Plot Details, you can proportionally change the size of axis titles, tick labels, legend and text objects.
At this point, you no longer know what the size of your text labels is unless you hover on a selected label. The following figure shows the effect of resizing on font sizing. The graph on the left was merged with three other similar plots to produce the 4 panel graph to the right. During the operation, text objects were scaled proportionally. You can see that the X axis title of the original graph to left indicates an actual font size of 22, while the same axis title in the merged graph to the right shows that the actual font size is now 10.1 after merging and rescaling.
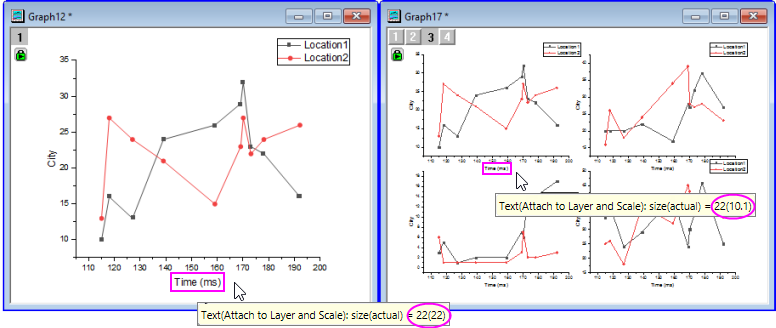
Font size discrepancies also arise when you create a text label, then use the Font Size list on the Format toolbar to change the size of a selected portion of the text label. Line weights are also affected by scaling. This is something that you'll also need to pay attention to as some journals specify minimum line weights in figures. The way to deal with both font size and line weight discrepancies is to activate your graph, then choose Graph: Fix Scale Factors and choose a factor of 1 (choosing 1 minimizes distortion and generally gives the best result). This will reset font size and line weights so that they are correctly indicated by the Font Size and Line/Border Width lists on the Format and Style toolbars.
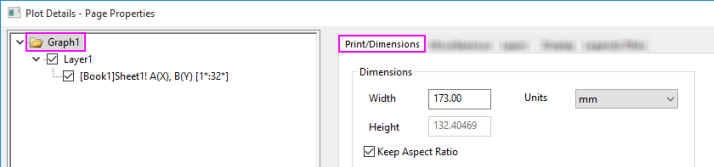
- Specify Page Size: Here, you will take the width dimensions required by your journal and set you graph page size using the Dimensions group settings on the Print Dimensions tab of Plot Details (Format: Page). Note that you can set the Width and Height independently, or you can set the Width and check the Keep Aspect Ratio box.
- Adjust Font Size: Having reset your font sizes in step 1, you can now modify font sizes, as needed, in your graph to comply with your journal's minimum and maximum font size requirements. Also, don't forget to check on font face requirements (e.g. serif vs. sans-serif).
- Fit Layers to Page: In step 2, you set your target graph page size, but you may find that you need to remove some white space from around your graph. Activate the graph window, then choose Fit Layers to Page. In the dialog that opens, enter a Margin (5% is a good starting point) and, if desired, check the Maintain Layer Aspect Ratios box.
- Export with 100% Page Size: With your graph active, choose File: Export Graphs and open the expGraph dialog box.
- Choose your Image Type.
- Under Export Settings set Margin Control to Page.
- Under Image Size Specify Size in page ratio and accept the default of 100%.
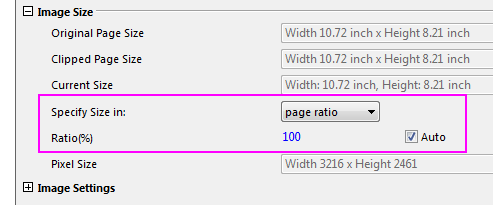
- If you have chosen a raster image type, set your target DPI Resolution.
- Choose monochrome, gray-scale or color, as needed.
When finished, you can Preview, then click OK to export your graph.
Keywords:journal, width, height, DPI, disk, PDF, EPS, JPEG, TIFF, large, file, 600, 1200, Fit Layers to Page, Fix Scale Factors, raster, vector, aspect ratio, page ratio
|