1.273 FAQ-1132 How to create a gray legend of box chart?customize-box-legend-to-gray
Last Update: 4/11/2022
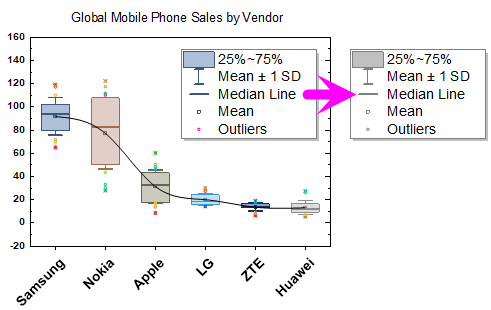
The legend symbol of a Box chart follows the the first box style by default. If you want to customize the box in the legend, for example, create a gray box legend,
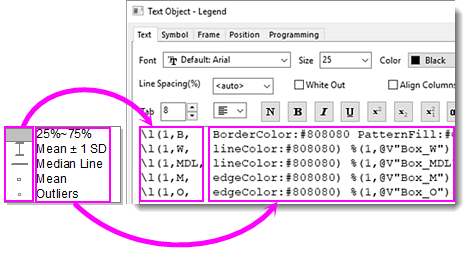
- Right click on the legend and select Properties context menu.
- Replace the default legend syntax with following
\l(1,B, BorderColor:#808080 PatternFill:#C0C0C0) %(1,@V"Box_R")
\l(1,W, lineColor:#808080) %(1,@V"Box_W")
\l(1,MDL, lineColor:#808080) %(1,@V"Box_MDL")
\l(1,M, edgeColor:#808080) %(1,@V"Box_M")
\l(1,O, edgeColor:#808080) %(1,@V"Box_O")
 | - You can customize the box/line/edge/scatter color by changing the corresponding color hex #808080.
- Learn more about Box chart legend customization on this page.
|
Keywords:plot label, data label, legend, line plot, box graph, substitution notation
|