1.21 FAQ-133 How do I label the data points in my graph with the x, y values?Label-Ploints-with-XY
Last Update: 6/24/2020
To Add Data Labels to All Points
To label all your data points with (X,Y) values, please follow these steps:
- Double-click on your data points in your graph and the Plot Details dialog will open.
- Go to the Label tab and check the Enable checkbox.
- Select (X,Y) from the Label Form drop-down list.
Or
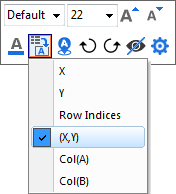
- Click on the plot, and then click on Show Data Labels button
 in the Mini Toolbar. in the Mini Toolbar.
- Click on the labels and then Mini Toolbar for the labels is shown. Click on the 'Label Souce button and select (X, Y) in the dropdown list.
Show at Specified Points Only
You can use Plot Details Label tab controls to show labels at specified points only. Points can be specified by row index or by X value.

For information, see Show at Specified Points Only.
To Add Data Label to a Specific Point
To label individual points, use the Annotation Tool, located on the Tools toolbar. The annotation tool is simply the data reader tool, but when you double-click on a data point, the (x,y) coordinate value will be displayed on your graph as a text label.

To Customize a Specific Annotation
In Origin 2017 and later, to customize a specific annotation, right click on that annotation and select Properties... to bring up Annotation dialog. You can click > button on Text tab to easily select commonly used labels. You can also customize the label according to your own need.
In Origin 2016, you can right click the annotation and choose Custom Labels... context menu to set Label Form. You can customize the label according to your own need by selecting Custom from Label From drop-down list and input format string in the Format Label edit box if you already knew the syntax. Alternatively, you can click the button next to Format Label edit box to further select a label type or an example from Examples fly-out menu.
In Origin 2015 and older, right click the annotation and choose Properties context menu. But the options are very limited.
To Move Annotation to Another Data Point
Hold Alt key and drag the annotation to new position. X,Y values will update accordingly.

Keywords:cursor, annotation, column, bar, coordinate
Minimum Origin Version Required: 2016 SR0
|