1.308 FAQ-1224 Why my graph doesn't match my data in worksheet?Graph-Not-Match-Data
Last Update: 8/19/2025
If you find the graph does not match the data from the source worksheet, you can troubleshoot by checking the following:
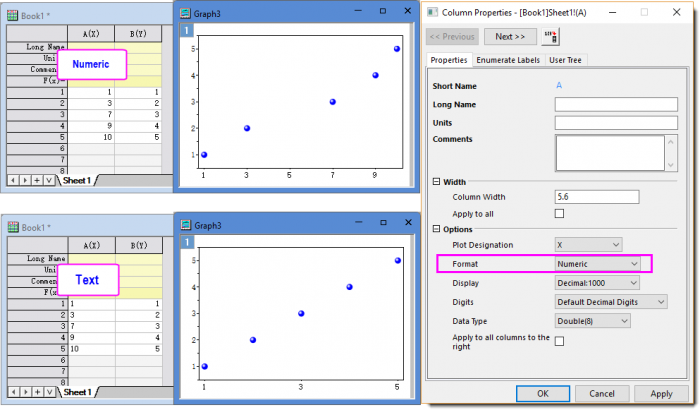
Check if worksheet data is in the correct format
If data in the source worksheet is left-aligned, it is Text format rather than Numeric (which is right-aligned by default).
Note: You may need to resize the column width to check if it's left-aligned.
Right click on the column and select Properties.... In the Column Properties dialog, make sure the Format is set correctly.
Check if X column is set properly
Double click on the plot to open the Plot Details dialog. On the left panel, you can check which columns are used as X and Y.
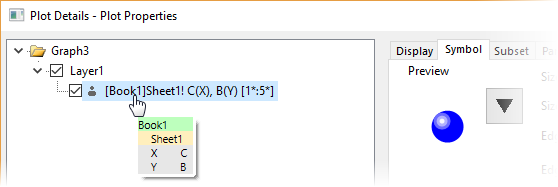
If the column that is supposed to be X isn't set as X, Origin will automatically use the nearest X column to the left of the Y column. If no X column in the sheet, the row index (<auto>) will be used.
- Right click on the desired column and click the X button on the mini toolbar to set it as X and then plot.
Or,
- On existing graph, right click on the plot and select Change X/Change Y to choose the correct X/Y column.
Check if built-in template has been overridden
If you plot with a built-in graph type menu but it doesn’t plot as expected, it’s possible a graph template with the same name of the built-in one is saved in the User Files Folder (UFF). This user-defined one has higher priority and used. Something may be wrong with it such as
- The template is saved as cloneable template so it will ignore column selections.
- The axis was fixed/manual so they don’t reflect the real data range.
- Open UFF by menu Help: Open Folder: User Files Folder.
- Locate the user-defined graph template.
- Rename the template.
Check if a new System Theme is set
This is rare. But if you have saved some graph theme with some axis range fixed, etc. and set it as system theme. Then when you plot with built-in graph template, such system theme will be applied onto the graph automatically and may have some issues.
- Select Preferences: Theme Organizer....
- On Graph tab, check if the bold theme isn't Light Grids. If a user-defined theme is bold,
- right click the user-defined theme and choose Edit to check what's in the theme.
Or,
- right click Light Grids theme and set it as system theme to roll back to built-in default.
Try to plot again.
Keywords:not pulling correct data, fail to make plot, plot not match source, plot wrong scale, plot disappear
|