2.3.2.2.5 Notations and syntax used in labeling plotted dataPlotLabel-LTNotation
In their simplest form, plot data labels might display unmodified coordinate values taken directly from the source worksheet cell. However, plot labels can be customized to show, for instance, coordinate values in some alternate numeric format or to display some bit of metadata associated with the data plot.
Custom plot labels are created by combining fixed strings with formatting syntax and notations, and entering this into Format String edit box in the Label tab of the Plot Details dialog. These custom labeling instructions can apply to specified points only; or to every point in a plot.
Predefined characters
These characters are used to represent the currently selected point(s). They can be used alone (e.g. Label Form = (X,Y)) or can be elements in more complex expressions (e.g. Label Form = Custom and Format String = $(wcol(n)[i],.4)).
| Characters
|
Description
|
| n, i
|
column and row indices in the source worksheet
|
| x, y, z
|
data point's X, Y, Z coordinates respectively
|
| ix, iy
|
data point's column and row indices when the plot is created from a matrix.
|
| zh
|
data point's Zh coordinate in the 3D ternary
|
 | wcol and col are used to refer to a certain column. wcol(n) takes numeric expression as argument and n is the dynamic variable that represents the current column index.
|
Syntax for formatting of Numeric and Date-Time data
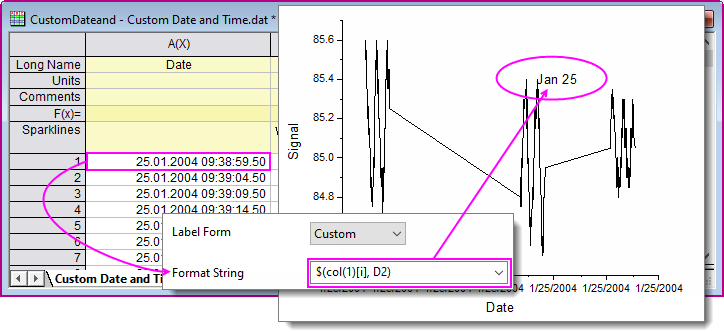
By default, labels on data points will display in the format of the source workbook data. However, the internally-stored numeric value in the workbook can be modified to display in any number of ways on the data plot.
The following image shows use of a custom Format String (the Label tab of Plot Details), to apply a different date-time format than that used in the source book.
Formatting Numeric data
For Custom formats that can be applied to numeric data, see the following links:
Formatting Date-Time data
For Custom formats that can be applied to date-time data, see the following links:
Labeling Plots with Metadata (Column Label Row Data)
In some instances, you may prefer to use plot metadata to label only the last data point in one or more curves, as an alternative to a default graph legend.
When labeling a curve in the Label tab of Plot Details, there are two syntaxes that you can use.
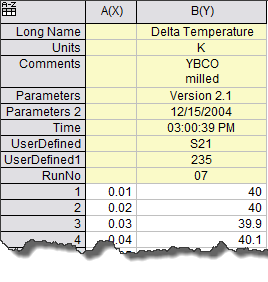
Taking the following worksheet as an example:
| Column Label Row
|
%(wcol(n)[ ]$) syntax
|
%(?,@ ) legend syntax
|
What is returned
|
| Short Name
|
%(wcol(n)[G]$)
|
%(?,@LS)
|
B
|
| Long Name
|
%(wcol(n)[L]$)
|
%(?,@LL)
|
Delta Temperature
|
| Units
|
%(wcol(n)[U]$)
|
%(?,@LU)
|
K
|
| Comments
|
%(wcol(n)[C]$)
|
%(?,@LC)
|
YBCO milled
|
| System Parameter
|
%(wcol(n)[P1]$)
|
%(?,@LP1)
|
Version 2.1
|
| User-defined Parameters
|
%(wcol(n)[D1]$)
%(wcol(n)[Time]$)
|
%(?,@LD1)
|
03:00:39 PM
|
| Note that system parameters are always named as Parameters, Parameters 2, etc. whereas user-defined parameters can have assigned names such as UserDefined, UserDefined1 or custom names such as Time, RunNo, etc.
|
Plot Labeling Examples
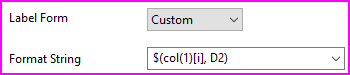
When you use Plot Details Label tab controls to label your plots, set the Label Form to Custom and choose or enter a Format String into the accompanying combo box.
For help with Numeric and Date-Time formats, see Origin Formats.
Example Format Strings and their application:
| Format String
|
Application
|
| $(wcol(n)[i],*4)
|
Use the numeric value in ith row of the current Y column as label. The value shows in 4 significant digits.
|
| My Label: $(col(Pressure)[i],.3)
|
Literal text "My Label:" followed by value in ith row of Pressure column will be used as label. The value shows in 3 decimal places.
|
| $(col(1)[i],D2)
|
Use the date value in ith row of the first column as label. The date value is displayed in the 3rd format of Display drop down list when you select Date to Format in the Format Cells dialog.
|
| $(col(2)[i], T15)
|
Use the time value in ith row of the second column as label. The Time value is displayed in the 16rd format of Display drop down list when you select Time to Format in the Format Cells dialog.
|
| %(wcol(n+1)[i]$) %(x$)
|
Use the text in ith row of n+1th column combined with the text of X value as label. n is the current Y column index.
|
| %(book2,iy,ix)
|
When you create a graph from a matrix, ix and iy refers to the current data point's X and Y indices in the source matrixbook. You can put the labels into a workbook, book2 in this example. %(book2,iy,ix) will use the value in cell of iy column and ix row in book2, sheet1 as current data point's label.
|
| %([book1]sheet2,iy,ix)
|
Similar to %(book2,iy,ix) above. But you can specify the worksheet in this example.
|
| %(MBook2,ix,iy)
|
Use value in cell (ix, iy) of matrixbook MBook2 (the 1st sheet and 1st object) as label. ix and iy are the data point's X and Y indices in the source matrix.
|
| $(Y)%(CRLF)$(p,0)%
|
When you create a stacked graph, you can use this string to display Y value and the corresponding percentile as label. "%(CRLF)" is used to separated the label into two rows. The percentile is shown in integer.
|
| %(?,@LL)
|
Use current Y column's LongName as label.
|
| $(Y*100, .1)%
|
Show decimal Y values as percentages, to 1 decimal place.
|
|