3.144 FAQ-878 How to eliminate the outliers by a user-defined defination?Identify-and-Eliminate-User-Defined-Outliers
Last Update: 7/3/2017
To identify the outlier cells in a worksheet by a self-defined outlier defination, you will need to use a LabTalk function. In the following sample codes, we define a value as "outlier" if its absolute Z value (=abs((x-MeanOfColumn)/SDOfColumn)) is larger than a certain preset threshold:
function dataset remoutliers(dataset ds1, double zthresh) {
  dataset ds2;
  double ii;
  sum(ds1);  //collect stats of ds1
  double summean=sum.mean;  //store mean
  double sumsd=sum.SD;      //store SD
  double nr=ds1.getSize();  //number of rows
  for(ii=1; ii<=nr; ii++) {
    ds2[ii]=abs(ds1[ii]-summean)/sumsd<=zthresh?ds1[ii]:0/0; //set missing if outlier
  }
  return ds2;
}
Then you can use function remoutliers to search out the whole worksheet. For example, to mask the outliers in the following worksheet:
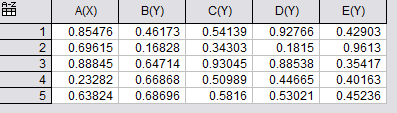
you can run the scripts below:
zthreshold=1.0;  //Set the threshold Z
nc=wks.ncols;  //number of columns
nr=wks.maxrows;  //number of rows
for(jj=1; jj<=nc; jj++){
	dataset ds=wcol(jj);
	range rc=wcol(jj);
	wcol(jj)=remoutliers(wcol(jj),zthreshold);
	for(ii=1; ii<=nr; ii++) {
    		if(rc[ii]==0/0) {
      		rc[ii]=ds[ii]; //recover the data from original
      		rc<ii>=1;      //if cell is missing, mask it
		}
	}
}
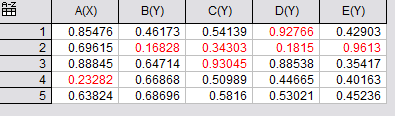
Finally you will get the following results.
Note: if your dataset is arranged by rows, you will need to transpose the worksheet columns first.
Keywords:mask outlier, detect outlier
|