8.4.2.1.8 The Reference Lines TabAxesRef-RefLines
To identify a specific value or range, you can add multiple reference lines at a constant or computed value on the axis and fill the area between paired reference lines .
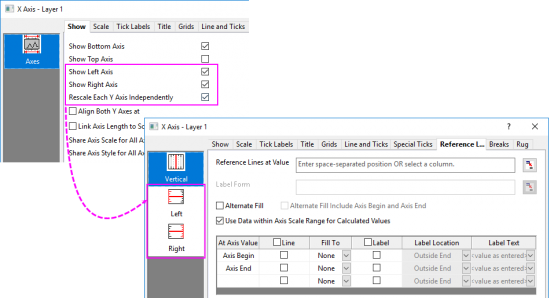
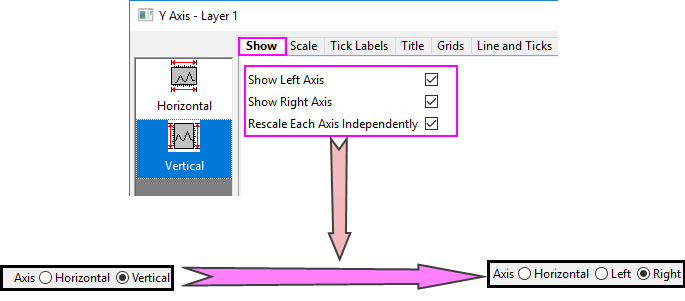
 | Origin allows you to show both right Y and left Y axis for general 2D graphs, and set Rescale Each Y Independently in the Show tab, there will be two seperate vertical icons Left and Right to let you add and cusotmize the reference lines for left Y and right Y axis seperately.
|
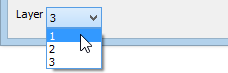
Layer Selection
Before customizing the elements of reference lines, you can use the Layer list to switch between layers in a multi-layer graph.
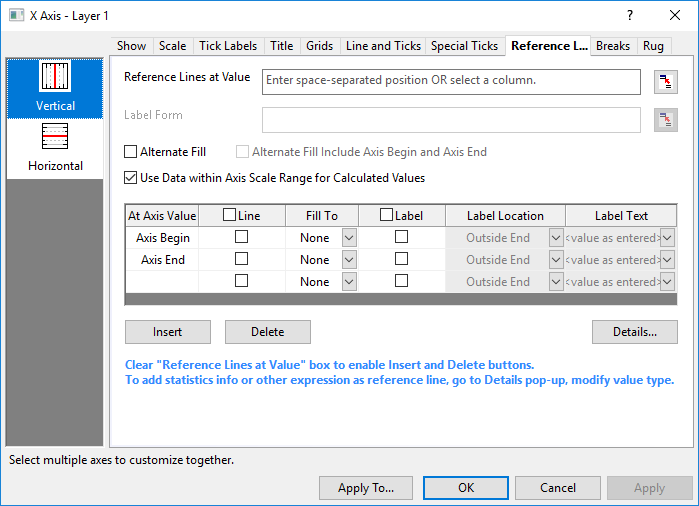
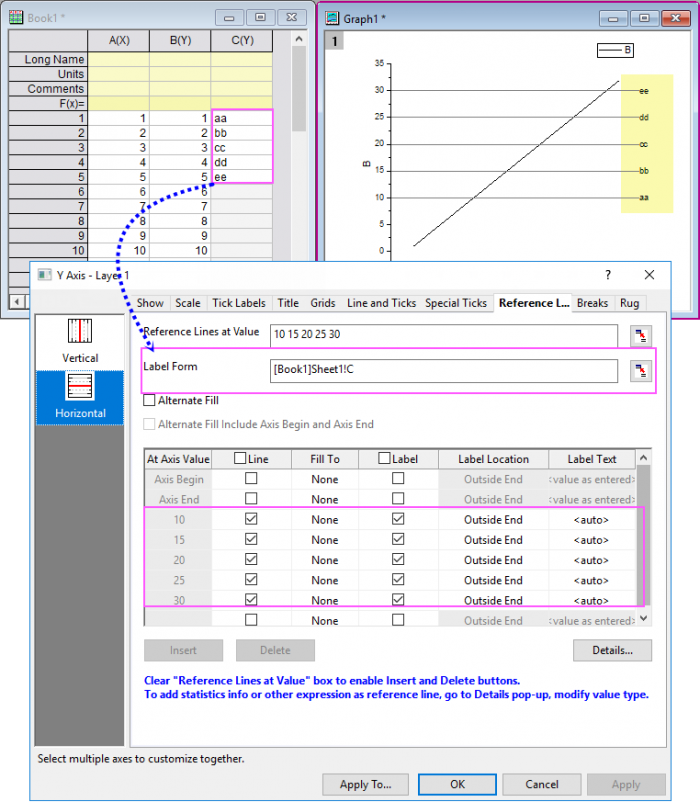
Reference Lines at Value
One way to add reference lines is to use this box to enter a space-separated list of values or point to a reference column of values (by clicking the Select Column interactive button  beside this text box) from worksheet. beside this text box) from worksheet.
Label Form
Once you have added reference lines with the option Reference Lines at Value, this option will avaliable to let you set the labels for these reference lines. You are allowed to enter a space-separated list of values or point to a reference column of labels(by clicking the Select Column interactive button beside this text box) from worksheet.
Note: This option is only available when you enter values or select a column for Reference Line at Value option. Labels entered in this option or stored in selected column will be applied as labels to the reference lines you added(except the axis begin/end ). When any label is entered or selected, Label check box for added reference line will be checked, and Label Text is set to <Auto>.
Alternate Fill
Alternate Fill
- Fill the area between every odd number reference line and its next even number reference line, such as RLine 1 ~ RLine 2, RLine 3 ~ RLine 4.
Alternate Fill Include Axis Begin and Axis End
- Do Alternate Fill including Axis Begin and Axis End. The filling order is Axis Begin to RLine 1. Axis End will be the last fill to if the custom line number is even.
Use Data within Axis Scale Range for Calculated Values
When you add a statistical reference line (e.g. the mean value) to a plot, you can check this check box to calculate the statistical value only for the data within the axis range. With this box unchecked, Origin will calculate the statistical values of the whole dataset. By default, this check box is checked.
Display Box for Reference Lines
List of all reference lines. The reference lines Axis Begin and Axis End will listed at top of this table by default. Note that you can also add lines here by entering a value into an At Axis Value cell (see next).
At Axis Value
Show the position of added reference lines. See this tip regarding use of named range.
Line
Specify whether to show the reference line at current axis value.
Fill to
Select a reference line from the drop-down list which current reference line should be filled to. If you've selected any Alternate Fill check box above, this column will show the pairing lines and be not editable.
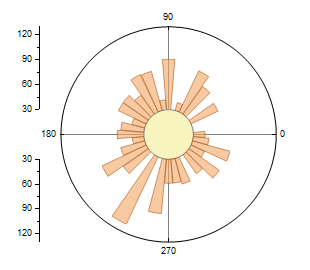
| For Polar plot, to fill the inside center circle, there is extra option for polar reference line.
- When the reference line is Axis Begin, and select Fill to= Axis Begin, it will fill from the circle center to Axis Begin line.
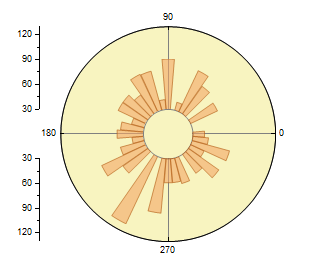
- When the reference line is Axis End, and select Fill to= Axis End, it will fill from the circle center to Axis End line.
Axis Begin reference line, fill to Axis Begin
(yellow area)
|
Axis End reference line, fill to Axis End
(yellow area)
|
|
|
|
Label
Specify whether to show label for the reference line.
Label Location
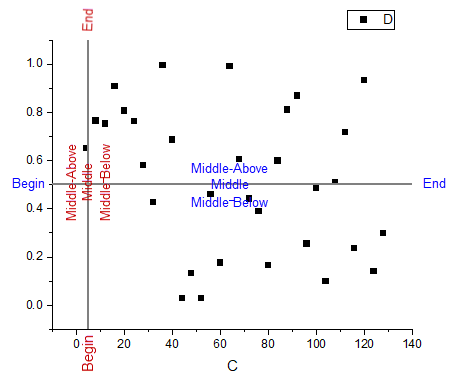
Specify the position of the labels. For both Horizontal and Vertical lines, possible positions are Begin, Middle-Above, Middle, Middle-Below and End of the reference lines.
Label Text
Specify what is to be shown as label for each reference line.
- The default, <value as entered>, displays the position value as label for the current reference line.
- Select <auto> to follow the tick label format settings of the Tick Labels tab of the Axis dialog (Type, Display, Set Decimal Places, Decimal Number).
- You can also type in a custom string using the form $(v, Formats) where v is the position value and Formats uses the syntax described under Origin Formats. There are two special cases:
$(v,D99) // v = Julian-Day value in the form "MM/dd/yyyy hh:mm:ss" when Tick Label Type=Date
$(v,T99) // v = Julian-Day value in the form "DDD:hh:mm:ss" when Tick Label Type=Time
- To insert a carriage return/line feed into your label, press CTRL + Enter (this inserts characters %(CRLF)).
By default, the label object has the following properties:
- A label is positioned at the top of the reference line but can display in the middle or at the bottom.
- A Name that displays on the Programming tab of the Properties dialog box. This name is RL(X/Y)#, where "X" or "Y" identifies the axis and "#" is the order in which the line appears in the Reference Lines list (e.g. RLX3 would be the third reference line in the list associated with the X axis).
- Attached to the graph by Layer and Scales.
- A Link to (%, $) Substitution Level of 1, which means the object is dynamically linked to value of variable v.
Button
There are three buttons under the display box:
| Insert
|
Insert a new reference line before the one you selected in display box.
|
| Delete
|
Delete one or more reference lines that are selected in the display box. (i.e. the reference lines other than the Axis Begin and Axis End ones). To select multiple lines, hold down Ctrl key and click on the reference line entries one by one.
|
| Details...
|
Open the Reference Lines dialog for further style customization of the reference lines.
|
| Note: To enable Insert and Delete buttons, you should clear Reference Lines at Value at first.
|
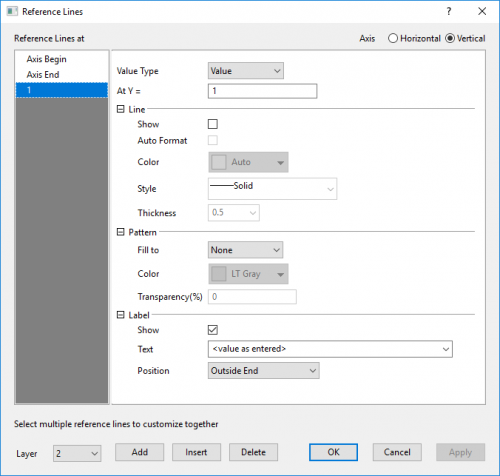
Details dialog for Reference Lines
This dialog can be opened by clicking the Details... button in the Reference Lines tab of Axis dialog. Use the Reference Lines dialog to add lines, set Value Type (e.g. Statistics) and customize formats and styles of each reference line.
| When this dialog is open, the main Axis dialog will be hidden. And you can click Apply button to apply the change in this dialog only, without coming back to the main Axis dialog. When you click the OK button to save settings (or click Cancel) and close this dialog , the Axis dialog will be visible again.
|
-
Axis Selection
You can choose one axis at the right-top corner to customize reference lines on different axis.
Once you have chosen Left Axis and Right Axis both and checked the Rescale Each Axis Independently check box in the Show tab, the Vertical axis will be seperated into two options Right and Left to let you customize the breaks on two different Y axes independently.
Value Type
Select the value type that the reference line specifies. It only appears for custom reference lines (excluding Axis Begin and Axis End).
| Beginning with Origin 2022b, you can use a named range in the At Axis Value box, when Value Type = Value or Expression (e.g. as part of an expression).
Also, note that when adding reference lines, the named range must have Scope = Project, even in plots of data from the worksheet where the named range is defined (data rows or label rows).
|
| Value
|
Add a reference line at a constant value on the axis.
|
| Expression
|
Add a reference line generated by a formula of curve or at a computed value calculated by an expression.
|
| Statistics
|
Add a reference line at a statistical value.
|
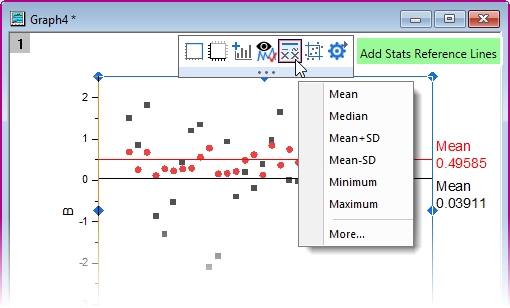
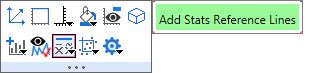
| Note that you can also use a Mini Toolbar button to Add Stats Reference Lines to plots, including Line, Scatter, Line + Symbol, Column/Bar, and Box and graphs:
- Click inside the layer to select the layer.
- Click on the Add Stats Reference Lines button to pick from a list of key stats.
- Click More to open the Reference Lines dialog box, if needed.
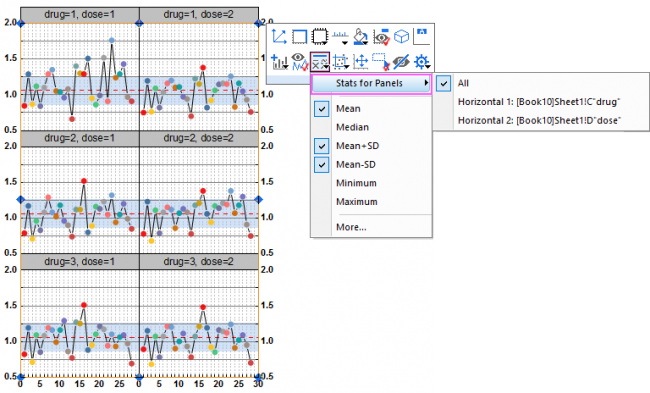
If there are horizontal/vertical panels enabled such as that in a Trellis plot, you can choose different level of the panels to add a reference line at the statistical value. By default, All is selected to add reference lines for all levels of panel.
|
At Axis Value
Specify the position at which the reference line should be added. It only appears for custom reference lines (i.e. control not available for Axis Begin and Axis End).
| For Value
|
Enter a constant value or named range. Regarding named range, see tip under Value Type, above.
|
| For Expression
|
Enter a LabTalk expression. Origin offers many built-in functions for building the expression. You can click the fly-out button next to the edit box, then select a function and insert it into the edit box.
Note that your expression can also incorporate a named range. See tip under Value Type, above.
Note: The letters x and y are the reserved variables that refer to the current x axis and y axis, respectively. If you want to add a line y = x + 1 to the graph, you can directly input “x + 1” in At Axis Value edit box.
|
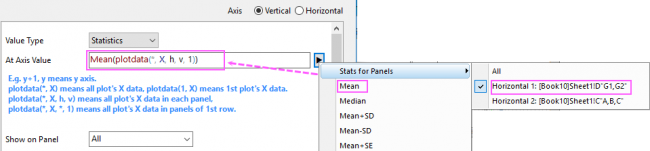
| For Statistics
|
Enter an expression that incorporates one of Origin's built-in statistical functions. You can click the fly-out button next to the edit box, then select a statistic and insert it into the edit box.
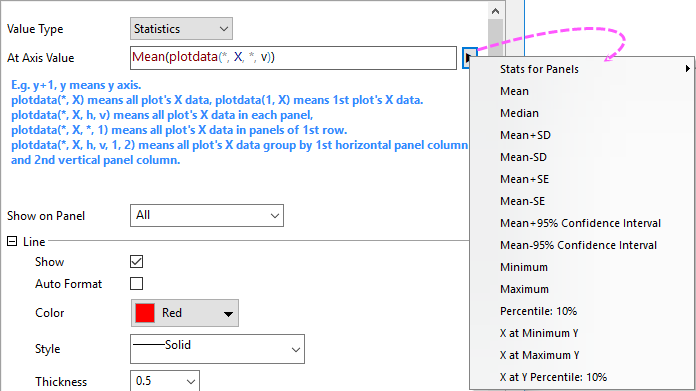
Stats for Panels is only available when there are horizontal/vertical panels. You can choose showing reference line(s) for which level of panels at specified statistical value(s).
See the following discussion of statistics syntax.
Note:
- In order to get the statistics info of the plot, we nest the function plotdata() within a statistical function. For example,
Min(plotdata(1,Y)); //The minimum value of the first plot’s Y data
Sometimes, you might want to add a vertical referene line at specific Y statistic value such as minimum, maximum or percentile of Y. You can select X at Minimum Y, X at Maximum or X at Y Percentile: 10% from the flyout menu and then further edit the corresponding syntax as needed.
- In trellis plot, we can get the statistics info of every panel by nesting plotdata(index, designation, h,v), for example,
Min(plotdata(1, Y, h, v)); //The minimum value of the first plot's Y data for every panel
Note that beginning with Origin 2021b, the layer-level Mini Toolbar button Add Stats Reference Lines automatically handles the syntax for each panel, for plot types such as Trellis in which "panel" is enabled (Panel tab at the plot level of Plot Details).
Likewise, we can get the statistics info of all horizontal panels for every panel row by plotdata(index, designation, *,v), and the statistics info of all vertical panels for every panel column by plotdata(index, designation, h,*). Nesting plotdata(index, designation) in a statistical function is to get the statistics info for all data of this trellis plot without considering panels, for example,
Min(plotdata(1, Y)); //The minimum value of all the first plot’s Y data in this trellis plot
- In trellis plot or other multi-panel graph, if there are 2 columns to define horizontal panel, 1st column contains value "G1" and "G2", 2nd column contains value "A", "B" and "C". plotdata(, X, h, v) will get 6 set of data, G1-A, G1-B, G1-C, G2-A, G2-B and G2-C. Now, if you want to get dataset for G1 and G2, two more parameters for plotdata can be used:
plotdata(, X, h, v, m, n); //''m'' is the level of horizontal panel, ''n'' is the level of vertical panel.
To get dataset for G1 and G2, you can use plotdata(, X, h, v, 1). plotdata(, X, h, v) equal to plotdata(*, X, h, v, 0, 0), which means the last level for both panel directions.
You can also implement this with the Stats for Panels fly-out menu:
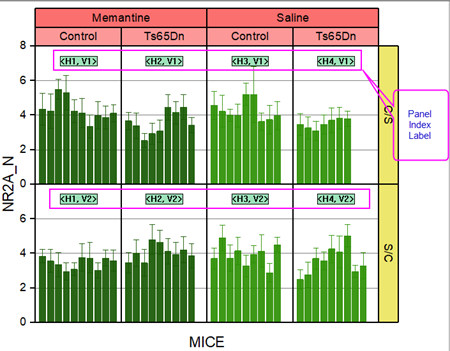
- Sometimes, we will mix up the panels in a different order after wrapping panels, exchanging XY, reversing axis. To help to figure out the real panel index, Origin will show the panel index labels on the trellis plot when you activate Reference Lines tab of Axis dialog.
| Statistical reference lines are dynamic and will recalculate and redraw with changes to supporting data, as for instance, when you add a data filter; you change data range; or when you hide or show data plots with the Object Manager.
|
|
| Note: Apart from the formula including the variable x and y, we should specify a single value in At Axis Value edit box. For dataset, only the first element will be taken account into. For example, the reference line will only show at x/y = sin(1) if we enter “sin(data(1,32))” in At Axis Value edit box.
|
Show on Panel
Specify on which panel the reference line is shown. It is only available in trellis plot. Use the commas to divide the panel index.
Line
The Show check box is consistent with the Line check box in the Display table. You can use it to show or hide the reference line.
Unchecking Auto Format check box to customize the Color, Style and Thickness of current reference line.
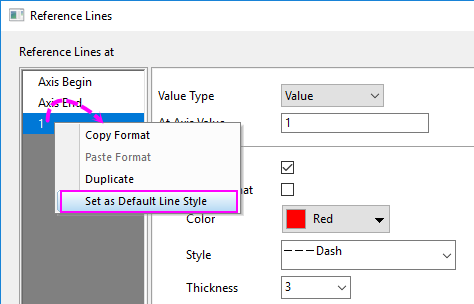
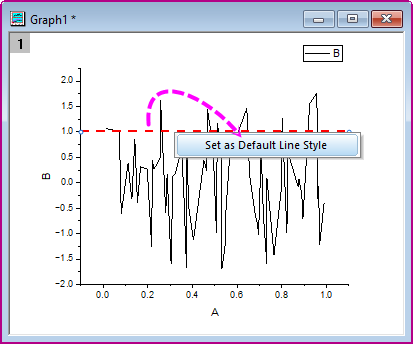
Set as Default Line Style
Once you have set the formats for a reference line, you can set the current line style as default. Then next time, when you added a new reference line, this default line style will be applied.
There are two ways to do this:
- In this Reference Lines dialog, right-click on the reference line with desired style to select Set as Default Line Style from the context menu.
- Go back to the graph, right-click on the reference line with desired style to select Set as Default Line Style from the context menu.
Pattern
Customize Fill Pattern between paired reference lines.
Select Fill To line(s) from drop-down list. It is consistent with the Fill To option in the Display table. If the Alternate Fill box is checked, this drop-down list is dimmed (unavailable).
- Customize Fill to for the selected line using the Color and Transparency options.
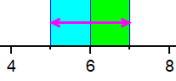
- Beginning with Origin 2020b, it is possible to fill to both the left and right of a given Reference Line (in prior versions, fill color could be applied only to one side of a line).
- Prior to Origin 2020b, reference line fills were drawn in numerical order (lower numbers on the axis scale drawn first) but as of 2020b they are drawn in the order listed in the Reference Lines table. This change could, for instance, produce a difference in the color of overlapping fill patterns (i.e. the color that was previously behind could now be drawn in front). To get Origin 2020b and later versions to use the older drawing behavior, set @ARLS = 1.
| Note: You can easily copy the style of one reference line to others by Copy Format and Paste Format in this dialog. Right click on a reference line in the left panel Reference Lines at and select Copy Format, and then select the target reference line(s) and right click to Paste Format. What's more, you can select Duplicate in the context menu to create a new reference line with the same style.
|
Label
Customize the label for reference line.
| Show
|
Specify whether to show a label for the reference line.
|
| Text
|
Specify what is to be shown as a label for the reference line. We have talked a lot in aforementioned section.
|
| Label Form
|
Specify which label form is to be shown for the reference line. It only appears for statistics reference lines.
- Value: To show the statistics value as a label.
- Quantity: To show the quantity as a label.
- Both: To show the statistics value and the quantity as a label in a format of quantity = statistics value.
- Custom: To show a customized text label.
|
| Identity of Plot
|
Specify which name to be shown on the label to identify the plot.
|
| Position
|
Specify the position of the labels.
|
Layer
You can switch layers with the Layer drop-down list.
Add/Insert/Delete Reference Lines
You can click Add, Insert or Delete button to add, insert or delete a reference line.
|