8.4.2.6 Axes Dialog for Parallel PlotsAxes_Dialog_Parallel_Coordinates
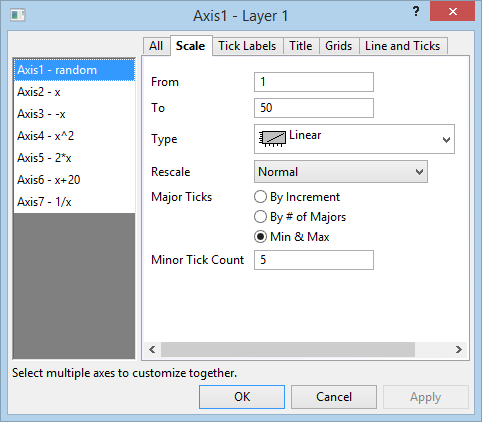
The Axis dialog box for parallel plots provides controls for customization of axis properties specific to parallel coordinates plots. Settings made on the tabs to the right side of the dialog are applied to those axes selected in the left side of the dialog. While each axis can be configured individually, note that you apply customizations to multiple axes by holding CTRL or SHIFT while selecting from the list of axes in the left panel.
All
Rescale Each Axis Independently
When this box is checked, each axis scale range is determined by the max and min values for the variable (the From and To values on the Scale tab). This allows for maximum dispersion of data points along the axis. When this box is cleared, all axes use a common scale range, determined by axis (variable) with the greatest range of values.
Margin(%Axis Length)
By default, this value is 0, allowing for maximum dispersion of data points along the axis. Entering a number n, adds an axis scale distance of n% at each end of the axis. It does not change From and To values.
Scale
From
Set the initial scale value in this text box.
To
Set the final scale value in this text box.
Type
| Linear
|
Standard linear scale: X'=X. 
|
| Log10
|
Base 10 logarithmic scale: X'=log(X). 
|
Rescale
| Fixed
|
The axis is not scalable. If you try to change the scale or perform an operation which changes the scale (for example, using the Scale In  tool), Origin preserves the From and To values. If both axes in a 2D graph layer are set to Fixed, using the Scale In tool opens a dialog box asking if you want to change to Normal mode and rescale. Click Yes to temporarily override the scaling restriction. tool), Origin preserves the From and To values. If both axes in a 2D graph layer are set to Fixed, using the Scale In tool opens a dialog box asking if you want to change to Normal mode and rescale. Click Yes to temporarily override the scaling restriction.
|
| Normal
|
The axis is scalable. Alter the axis scale and use the Scale In tool (for 2D graph layers) without restriction.
If you are adding or removing datasets from the graph using the Plot Setup or Layer Content dialogs, you will need to select the Rescale check box in those dialogs, if you want to automatically adjust scales on data change.
|
| Auto
|
This option is similar to the Normal option, but also allows Origin to automatically scale the axis to accommodate plotted data, if necessary.
|
| Fixed From - Normal To
|
The From value of the axis is fixed and can only be changed by editing the From text box value in the Axis dialog box, while the To value of the axis is in Normal mode.
|
| Normal From - Fixed To
|
The From value of axis is in Normal mode, while the To value of the axis is fixed and can only be changed by editing the To text box value in the Axis dialog box.
|
| Fixed From - Auto To
|
The From value of axis is fixed, while the To value of axis allows Origin to automatically rescale.
|
| Auto From - Fixed To
|
The From value of axis allows Origin to automatically rescale, while the To value of axis is fixed.
|
Major Ticks
Note that Major Ticks
Style must be set to something other than None (Line and Ticks tab).
| By Increment
|
Place a major tick mark at every n scale units and specify n in the accompanying text box. Tick labels are placed at each major tick mark. Optionally, specify a Minor Tick Count.
|
| By # of Majors
|
Place m major tick marks along the axis scale and specify m in the accompanying text box. Tick labels are placed at each major tick mark. Optionally, specify a Minor Tick Count.
|
| Min & Max
|
Place major tick marks only at Min (From) and Max (To) scale values. This is the default selection for parallel plots.
|
Minor Tick Count
Set the number of minor ticks to display between adjacent major ticks. Note that Minor Ticks Style must be set to something other than None (Line and Ticks tab).
Tick Labels
Tick Labels tab controls are divided among the Display tab and the Format tab.
Show Tick Labels
Use this drop-down to position tick labels before the axis, after the axis or to hide labels (None).
Show Minor Labels
Enable display of labels on minor tick marks.
Display tab
Display
| Decimal:1000
|
(1, 1000, 1000000, 1.00E+009)
Note: The threshold for conversion to scientific notation is controlled on the Numeric Format tab of the Options dialog box (Preference: Options).
|
| Scientific: 10^3
|
(1*100, 1*103, 1*106, 1*109)
|
| Engineering:1k
|
(1.0, 1.0k, 1.0M, 1.0G)
See * below for the supported Engineering data suffixes.
Note: A LabTalk system variable (@EF) is provided to enter engineering notation in a non-engineering column. Setting @EF = 1, and entering engineering notation in a non-engineering column, will cause Origin to treat the entry as numeric. Otherwise (@EF = 0), Origin will treat the entry as text (default).
|
| Decimal:1,000
|
(1, 1,000, 1,000,000, 1,000,000,000)
Note: The threshold for conversion to scientific notation is controlled on the Numeric Format tab of the Options dialog box (Preference: Options).
|
| Scientific:1E3
|
(1E0, 1E3, 1E6, 1E9)
Note: A Labtalk system variable (@ETE) can be used to hide the leading zero in scientific notation. By default it is set as 0, the values display as (1E+00, 1E+03, 1E+06, 1E+09). Setting @ETE=1 to hide the leading zero in scientific notation, then the values display as (1E+0, 1E+3, 1E+6, 1E+9).
|
| Custom
|
Select this option to specify a user-defined tick label format, such as setting the number of significant digits or decimal places. Use the Custom Format combo box to either select an option from the drop-down or type it in.
|
- *Origin supports the following Engineering data suffixes:
| suffix
|
equivalent
|
quantity
|
| k
|
kilo
|
10^3
|
| M
|
mega
|
10^6
|
| G
|
giga
|
10^9
|
| T
|
tera
|
10^12
|
| P
|
peta
|
10^15
|
| m
|
milli
|
10^-3
|
| u
|
micro
|
10^-6
|
| n
|
nano
|
10^-9
|
| p
|
pico
|
10^-12
|
| f
|
femto
|
10^-15
|
|
Note: "u" is Origin's universal notation for micron. The only exception is graph axes tick labels, which support "mu". Note also that Origin 7 does not support "E" and "a" as suffixes.
|
Set Decimal Places
Specify the displayed decimal places in the Decimal Number edit box.
Decimal Number
When Set Decimal Places is selected, specify the displayed decimal places with an integer value.
Divide by Factor
Each major and minor tick label is divided by the number in this text box. Note that this text box also supports expressions. For example, to divide all labels by 1/3, enter 1/3 in the text box (this will multiply all the labels by 3).
Prefix
Type a prefix in this text box to display it before each tick label.
Suffix
Type a suffix in this text box to display it after each tick label. For example: mm, mF, K.
 | Both Prefix and Suffix text boxes support special formatting commands called "escape sequences". For instance, to append the lower-case Greek "p" (π) symbol to each tick label you would enter \g(p) or \g(\(x0070)) into this box. To learn more, see Escape Sequences.
|
Plus Sign
Select the Plus Sign check box to show a plus sign before each positive tick label.
Minus Sign
Select the Minus Sign check box to show a minus sign before each negative tick label.
Format tab
Color
Select the desired major and minor tick label color from this drop-down list. When Auto is selected, the color of the tick labels follow the color of the axis line.
For information on using the Color Chooser, including the defining of custom colors, see Defining and Using Custom Colors.
Font
| Font
|
Select the major and minor tick label font type from this drop-down list.
|
| Size
|
Type or select the desired text size (in points) for the major and minor tick labels.
|
| Bold
|
Select the Bold check box to change the major and minor tick labels style to bold.
|
| White Out
|
Select to draw a separate white background for text in the tick labels
|
Rotate(deg)
Origin supports arbitrary rotation of tick labels. Type a positive number in this text box to rotate labels counterclockwise, and a negative number to rotate labels clockwise (Origin will change the typed negative number into the corresponding positive number counterclockwise).
Alignment
Choose from three radio buttons on how should the tick labels align with their corresponding axis ticks.
| Center
|
Center the tick labels with the major ticks.
|
| Center between Ticks
|
Locate tick labels equidistantly between adjacent major ticks.
|
| Next to Ticks
|
Align the left edge of the tick labels with the major ticks.
|
Offset in % Point Size
Type the desired value in the Horizontal and Vertical text boxes to control the horizontal and vertical position of the tick labels relative to the axis (100%=one full font width).
Note: You can manually nudge tick labels by selecting them and using the arrow keys to position them. This applies to special tick labels, also.
Labels Stay with Axis
Select this check box to ensure that tick labels always stay adjacent to the axis. When this check box is deselected, the tick labels remain in their default position, even if the axis position is altered.
| You can click to select tick labels and nudge them using the arrow keys on your keyboard.
|
Title
Show
Show the title for the selected axis.
Text
By default, the axis title is %(?Y). This translates to "Long Name (otherwise, Short Name) + Unit" of the Y column of a specified plot. Axis titles can be constructed using worksheet column label row information other than Long Name/Short Name and Units. For instance, to use the first user-defined parameter value in the Y column, you would enter %(?Y, @LD). See the Complete List of @Options for details.
While it is often preferable to use variable notation as described above -- particularly when saving your customizations to a template file -- you can simply type your axis title text (a) into this Text box or (b) directly into the axis title object on the graph page.
| If, when using %(?Y) to display Long Name + Units, your axis titles run together, try using %(?YM) This will force units to display on a second line.
|
Color
Select a title text color from this drop-down list. See Defining and Using Custom Colors.
Rotate
Origin supports arbitrary rotation of the title. You can select or enter a positive value in this text box to rotate the title counterclockwise; a negative value to rotate title clockwise.
Font
Font: Select the title text font in the drop-down list.
Size: Specify the axis title size in the combo box.
Grids
Major Grid Lines/Minor Grid Lines
Show: Select the Show check box to display major/minor grids. Major grid lines are straight lines that emanate from major tick marks.
Color: Select the desired line color from the associated drop-down list. See Defining and Using Custom Colors.
Style: Select the desired line style from the associated drop-down list.
Thickness: Type or select the desired line thickness (in points) from the Thickness combination box.
Lines and Ticks
Line
Show: Check on this check box to display line on the selected axis.
Color: Select a line and tick color from this drop-down list. See Defining and Using Custom Colors.
Thickness: Type or select the desired line thickness (in points, where 1 point=1/72 inch) for the axis and ticks from this combination box.
Arrow: Check on this check box to display arrow at axis begin or end.
| Shape
|
Select an arrow shape from this drop-down list.
|
| Width
|
Type or select the desired arrow thickness (in points) from this combination box.
|
| Length
|
Type or select the desired arrow length (in points, where 1 point=1/72 inch) from this combination box.
|
| Offset(%)
|
Type or select the desired value from this combination box to control the position of the arrow relative to the axis end.
|
Major Ticks/Minor Ticks
Style: Control the display style of major/minor ticks from this drop-down list.
Length: Type or select the desired major/minor tick length (in points, where 1 point=1/72 inch) from this combination box.
Auto: For minor ticks, the length is half that of major ticks.
Color: Control the color of the major/minor ticks from this drop-down list. See Defining and Using Custom Colors.
Thickness: Type or select the desired major/minor tick thickness (in points, where 1 point=1/72 inch) from this combination box.
|