8.4.2.1.6 The Line and Ticks TabAxesRef-LineTicks
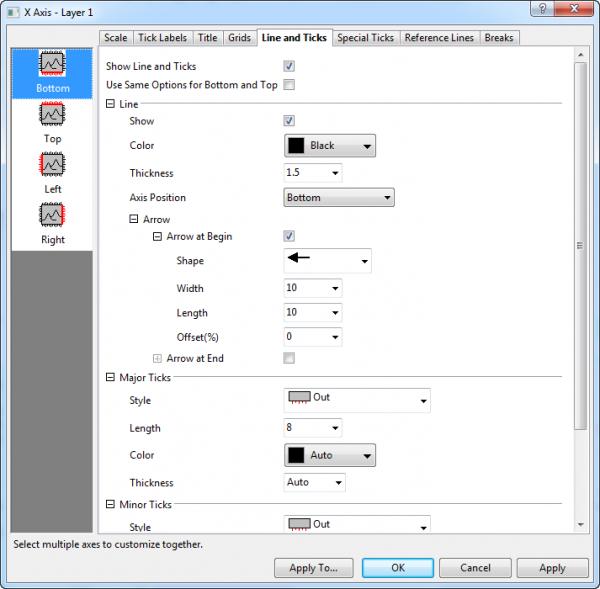
This tab provides controls for axis line and ticks, including the line and ticks style and position etc. For 2D graphs, you can separately customize the Bottom/Top (Left/Right) direction; for 3D graphs, you are allowed to show two axes for X, Y and Z direction, then there are six directions(Front/Back, Right/Left and Bottom/Top) to be customized.
|
| Axis Line and Ticks for most 2D/3D Graphs
|
Show Line and Ticks
Check on this check box to display line and ticks on the selected axis. To hide line and ticks, clear this box.
Use Same Options for Bottom and Top
Check this box to use the same Title options for both bottom and top (left and right) axis. When the box is checked, the Bottom and Top (Left and Right) options are shared. You only need to customize the bottom and
Line
Show
Check on this check box to display line on the selected axis.
Color
Select a line and tick color from this drop-down list. Auto means using the Fill color of the plot but a darker version. If the plot fill color is set to "None" or "Auto", Origin uses a darker version of the border color If no fill color (Line plot for example), follows the line color.
Thickness
Type or select the desired line thickness (in points, where 1 point=1/72 inch) for the axis and ticks from this combination box.
|-
Axis position (2D Graph only)
| Bottom (X), Top (X), Left (Y) or Right (Y)
|
Move the axis back to its default location.
|
| % from Bottom (Top, Left, Right, etc.)
|
Offset the axis from its default location. Type a "percent-of-axis-length" value in the Percent/Value text box. For axis in 2D graph layers, type a positive value to move the axis away from the center of the page; type a negative value to move the axis toward the center of the page.
|
| At Position=
|
Position the axis at a specific X or Y axis scale value. Type the X or Y value in the Percent/Value text box.
|
Axis position (3D Graph only)
| Bottom (X), Left (Y) or Front(Z)
|
Move the axis back to its default location.
|
| % from Bottom (Left, Front)
|
Offset the axis from its default location. Type a "percent-of-axis-length" value in the Percent/Value text box. For axis in 2D graph layers, type a positive value to move the axis away from the origin of the coordinates; type a negative value to move the axis toward the origin of the coordinates.
|
| At Position=
|
Position the axis at a specific X, Y or Z axis scale value. Type the X, Y or Z value in the Percent/Value text box.
|
Arrow
Specify whether show arrow for the current axis, in both 2D and 3D graph.
Arrow at Begin/End
Check the Arrow at Begin or Arrow at End check box to add the arrow for the axis at begin or end.
In the below three drop-down lists, you can specific the Shape, Width and Length for the arrow.
The Offset(%) combo box, which is % of axis length, can be used to make arrow extend by percent of axis length so arrow will be longer than axis frame/plane.
Major/Minor Ticks
Style
Control the display style of major/minor ticks from this drop-down list.
Length
Type or select the desired major/minor tick length (in points, where 1 point=1/72 inch) from this combination box.
Auto: For minor ticks, the length is half that of major ticks.
Color
Control the color of the major/minor ticks from this drop-down list.
Thickness
Type or select the desired major/minor tick thickness (in points, where 1 point=1/72 inch) from this combination box.
|