8.4.1 Controlling the Graph Axis Display RangeAxis-DisplayRange-Control
You can change the graph axis display range manually using the From and To settings on the Scale tab of Axis dialog box (General 2D and 3D graphs). Several other operations -- notably the Axis Zoom In shortcut menu command and the Scale In/Scale Out buttons (Tools toolbar) -- also change the graph axis display range, while simultaneously changing the From and To settings in the Scale tab.
Controlling axis scale values manually
When you plot data from the worksheet or import data into a graph window, the graph layer's axes are automatically scaled to include all data points in the data plot, plus some additional padding at the lower and upper ends of that scale. The additional padding is the Rescale Margin and how it affects axis scales is covered here.
To change the axis scale range manually:
- Double-click on the X, Y, or Z axis to open the respective Axis dialog box.
- Select the Scale tab.
- Select the axis icon from the left panel.
- Type your starting axis scale value in the From text box.
- Type your ending axis scale value in the To text box.
- Click Apply. At this point, your axis scales will display the exact range you have entered. However, any action which triggers rescaling will likely reset From and To values.
- To preserve what you have manually entered in From and To, set the Rescale drop-down to Fixed before clicking OK (see Disabling automatic range rescaling, below).
Controlling Rescale Margins
When rescaling graph axes, the Rescale Margins setting will pad dataset minimum and maximum values by specified percentage of the difference between the minimum and maximum data values in the N dimension.
To change the Rescale Margins,
- Right-click on the axis to select the shortcut menu Rescale Margins... to open the Edit Rescale Margin dialog.
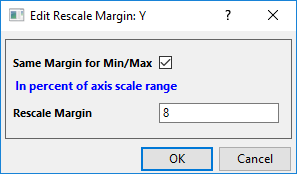
- By default, the Same Margin for Min/Max check box has been checked, which means the rescale margin for Min and Max will share same percentage that you sepcified in Rescale Margin box.
- After unchecking the Same Margin for Min/Max check box, you will see there are two seperate Rescale Margin setting boxes for Min and Max. Enter the percentage values you want to control the rescale margin of Min/Max axis scale seperately.
Of course, you can double-click on the axis to open Axis dialog, and set Rescale Margin(%) in Scale tab. In this case, the specified margin will be applied to both the Minimum and Maximum values.
Please note, some graph types or plot axes don't support changing rescale margin with the short-cut menu Rescale Margins..., you have to open Axis dialog to set the shared margin, such as tenary graph, smith graph, polar graph, and the Z axis of 3D graph.
Changing the axis scale by dragging axis
You are allowed to drag the red dots at the ends of axis or axis line to rescale the axis:
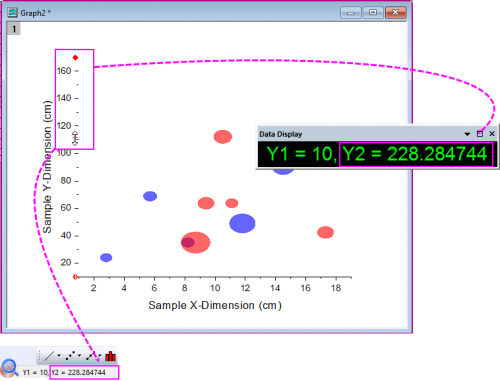
- Click the axis line to show two red dots at the begin and end of the axis line, move the mouse on the red dot and drag vertically(for Y axis) or horizontally(from X axis) to change the From/To of axis scale.
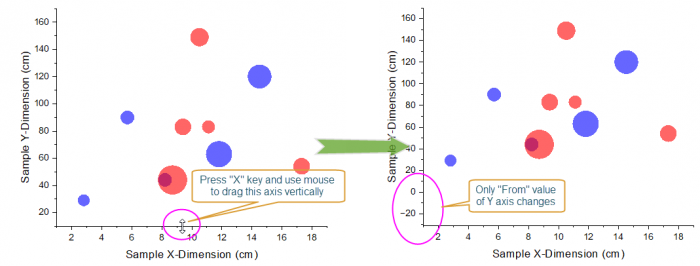
- Hold down X key(or press Scale Zoom-Panning Tool button
 ), move the mouse on the Y/X axis line, drag and drop the axis horizontally/vertically to change the From or To value for X/Y axis scale. ), move the mouse on the Y/X axis line, drag and drop the axis horizontally/vertically to change the From or To value for X/Y axis scale.

Note:
- When you drag the red dot or axis line(with "X" key pressed), the current From/To value of the axis will show on both Data Display and on Status Bar.
- When you hold down "X" key and drag the X/Y axis line, it only change the From or To value for the Y/X axis, which is different from the Panning tool
 . .
Changing the axis scale range with the Axis Zoom menu commands
To change the axis scale range:
- Decide which axis scale value you want to zoom in on.
- Right-click on that axis tick label.
- Choose Axis Zoom In from the shortcut menu.
Origin rescales the axis so that the axis scale value that you chose in step 1. displays near the center of the graph axis. This narrows the range of the From and To values in the Axis dialog box. Note that this is similar to changing the axis scale using the Center shortcut menu command (see below).
To return the axis scale to its full range:
Note that the shortcut menu item, Axis Zoom Out has the effect of expanding the scale range. However, to show all data and return to the original scale values:
- Right-click on the axis tick labels.
- Select Rescale to Show All from the shortcut menu or click the Rescale button on the Graphs toolbar.
Changing the axis scale range with the Scale buttons (Tools toolbar)
- Click once on the Scale In button
 (Tools toolbar). (Tools toolbar).
- Drag out rectangle(s) around the region of the graph that you want to enlarge. Once you release the mouse button, the axes rescale to display only the selected region.
You can enlarge continuously to finally view the specific axis range you want. Then, press ESC key to escape the magnifying mode.
To return the previous axis scale:
- Click once on the Scale Out button
 on the Tools toolbar. on the Tools toolbar.
To return the axis scale to the full range:
- Click several times on the Scale Out button on the Tools toolbar.
- click the Rescale
 button on the Graph toolbar. button on the Graph toolbar.
|
Note: These Scale In/Scale Out buttons alter the From and To Scale tab settings while the View: Zoom In and Zoom Out menu commands simply change the view of the graph page without altering the minimum and maximum axis scale values.
|
| Note: Press down on the Ctrl key and then click Scale In button. Drag out a rectangle to select a region of graph and a graph window named "Enlarged" will be created to show the region in detail. This works on 2D graphs and will even work on a graph that has multiple linked layers as long as the layers are overlapped and share a common axis (% of Linked Layer has Left/Top set to 0 and Width/Height set to 100, plus Straight (1 to 1) linking to the parent layer).
|
Changing the axis scale range with the Rescale Tool
To change the X axis scale range:
- Click the Rescale Tool button and press Z, or simply press Z.
-
- Right-click & drag right/left
or
- Use the mouse wheel
or
- Use +/- keys
to change the horizontal axis scale range
To change the Y axis scale range:
- Click the Rescale Tool button , press Z and hold the Shift key down, or simply press Z+ the Shift key.
-
- Right-click & drag up/down
or
- Use the mouse wheel
or
- Use +/- keys
to change the axis scale range vertically.
To change the Z axis scale range:
- Click the Rescale Tool button and press D, or simply press D.
- Use the mouse wheel or +/- keys to change the axis scale range vertically.
Changing axis scale range with the Center shortcut menu (2D&3D)
To center your data plot on a particular axis scale value:
- Right-click on a tick label.
- Choose Center from the shortcut menu.
This alters the From and To values in the Axis dialog box.
To return the axis scale to its full range:
- Right-click on the axis tick labels.
- Select Rescale to Show All from the shortcut menu, or click the Rescale button on the Graphs toolbar.
Changing the axis scale range with the Zoom In /Out shortcut menu (2D&3D)
To Zoom In / Zoom Out the data plot axis scale
- Right-click on a tick label.
- Choose Zoom In / Zoom Out from the shortcut menu.
This alters the From and To values in the Axis dialog box.
Disabling automatic range rescaling
You may want to exert manual control over axis values to prevent rescaling (as can happen when you add or remove data from the graph layer). You can partially or completely disable the automatic rescaling of axes:
- Double-click on the X, Y, or Z axis to open the respective Axis dialog box.
- Select the Scale tab.
- Select the axis icon from left panel.
- Select the rescale mode from the Rescale drop-down list.
| Fixed
|
The axis is not rescalable. If you try to change the scale or perform an operation which changes the scale (for example, using the Scale In tool), Origin preserves the From and To values.
If both axes in a 2D graph layer are set to Fixed, using the Scale In tool opens a dialog box asking if you want to change to Normal mode and rescale. Click Yes to temporarily override the scaling restriction.
|
| Normal
|
The axis is rescalable. Change the axis scale and use the Scale In tool without restriction (2D graphs).
If you are adding or removing datasets from the graph using the Plot Setup or Layer Management dialogs, you will need to select the Rescale check box in those dialogs, if you want to automatically adjust scales on data change.
|
| Auto
|
This option is similar to the Normal option, but allows Origin to automatically scale the axis to accommodate plotted data (no need to select the Rescale check box in Plot Setup or Layer Management, for instance).
|
| Fixed From - Normal To
|
The From value of the axis is fixed and can only be changed by editing the From text box value in the Axis dialog box, while the To value of the axis is in Normal mode.
|
| Normal From - Fixed To
|
The From value of axis is in Normal mode, while the To value of the axis is fixed and can only be changed by editing the To text box value in the Axis dialog box.
|
| Fixed From - Auto To
|
The From value of axis is fixed, while the To value of axis is allows Origin to automatically rescale.
|
| Auto From - Fixed To
|
The From value of axis is allows Origin to automatically rescale, while the To value of axis is fixed.
|
Rescaling axes to display data that extend beyond the current axis scale range
Use this to reset the axes scale values so that all the data included in the active graph layer are displayed. This operation may be needed when datasets whose minimum and maximum values fall outside the current range of axis values are added to the layer contents, or when the worksheet display range is modified.
To reset the axes scale values:
- From the menu, select Graph: Rescale to Show All.
or
- Click the Rescale button on the Graph toolbar.
The operation has no affect on the Speed Mode setting which reduces the number of points in a data plot by plotting only every nth data point in the data set. The rescale operation resets axis scale values only.
|
Note:
- If you have selected Manual from the Rescale drop-down list as explained above, Origin asks you if you want to override the manual rescale setting. If you click No, the axes will not rescale to show all the data.
- From Origin 2018b, if you have multi-layer graph and layers are linked, clicking the Rescale button will rescale the axis ranges of all linked layers, no matter the axes are linked or not, or which layer are active.
|
|