8.2 The Page-Layer-Plot HierarchyPage-Layer-Plot-Hierarchy
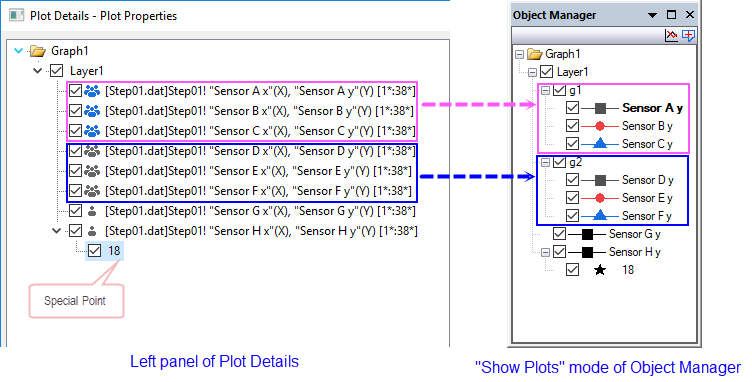
Every Origin graph window is constructed using a graph template -- either built-in, online or user-modified. The contents of every Origin graph window are organized in a Page > Layer > Plot hierarchy, with the page at the topmost level (represented by the Graph1 icon in Plot Details dialog and Object Manager window). You are also allowed to add special points under the plot level.
Generally:
- The page must contain at least one -- and may contain multiple -- graph layer(s).
- The layer(s) (generally) contain one or more data plots. The plots can be grouped together and shown with grouping indicator(
 and and  alternately in Plot Details; g# in Object Manager). alternately in Plot Details; g# in Object Manager).
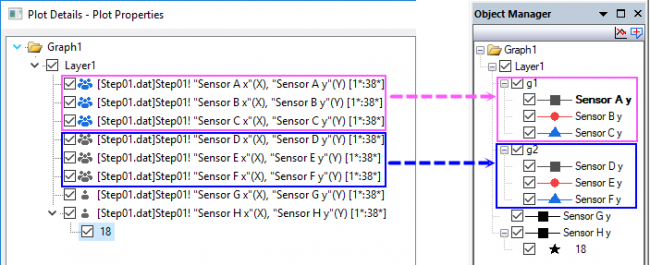
- The data plot (generally) consists of one or more data points (in a 2D graph, the data point is a single XY pair or an error bar or data label; in applicable 3D graphs, the data point represents an XYZ triplet).
- The special point is created manually after plotting the graph. You can add multiple special points on one plot.
Each object in this page-layer-plot hierarchy has associated objects and/or properties. It will be helpful for you to develop some sense of which objects and properties are logically associated with each level in this Page > Layer > Plot hierarchy. Note that each Layer and Plot has a checkbox to its left which allows you to Show (checked) or Hide (unchecked) that element.
For instance:
- If you wish to change the size of a graph page so that an exported image of the graph has precise measurements, you will need to edit the properties of the graph page. For a general discussion of the graph page, see customizing graph page elements.
- If you are looking to modify a graph's axis scales, it helps to know that the axis is part of the graph layer -- a moveable, sizeable unit composed of (1) a set of X and Y (and optionally, Z) coordinate axes, (2) one or more data plots, and (3) associated axis titles, text labels and drawing objects. For a general discussion of the graph layer, see customizing graph layer elements.
- If you are attempting to change the symbol shape of your scatter graph, for example, it helps to know that symbol shape is a property of the plot. For a general discussion of the plot, see customizing plot elements.
At the risk of stating the obvious, we will note that any property of the graph page will apply to all graph layers in that page and any property of the graph layer will apply to all plots in that graph layer. At the plot level, we will modify this to say that any property of the plot applies to all data points in that plot except where the properties of a single data point have been customized (applies only to 2D scatter and line & symbol plots).
In addition, note that Origin has several page viewing modes which help you to either have faster screen redraw speed or have more graph display accuracy. You can refer to the page Available Page Viewing Modes: Speed vs. Accuracy for details.
|