19 Peak AnalysisPeakAnalysis
Origin provides several tools for analyzing peak data. Custom analysis settings for each tool can be saved as a theme for repeat use.
There are more Peak Analysis apps provided in the Analysis: Peaks and Baseline: More Apps context menu.
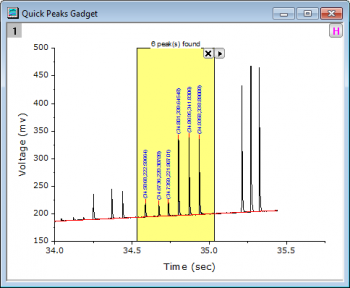
With Quick Peaks Gadget, you can instantly view the peak centers and peak heights,etc, of multiple peaks by moving and resizing a yellow rectangle (ROI) to cover interested region. This gadget also enables users to easily detect or subtract baselines, find peaks, perform integration, and fit peaks (OriginPro) on a graph.
Cons: Quick Peaks Gadget does not support batch processing multiple files or datasets.
To Open Quick Peaks Gadget
Plot your data and with the graph window active go to menu Gadgets: Quick Peaks....
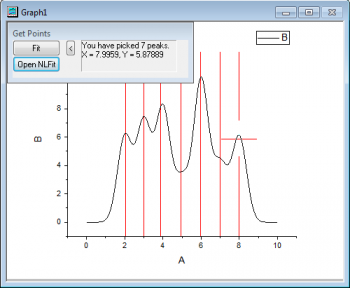
With Multiple Peak Fit tool, you simply need to double click around desire peak centers to locate them and quickly generate final peak analysis report. It is ideal for fitting a small number of peaks where the peaks are well separated from each other.
Cons: Do not provide baseline correction capability.
To Open Multiple Peak Fit Tool
Select Analysis: Peak and Baseline: Multiple Peak Fit from the main menu. This will open the nlfitpeaks dialog.
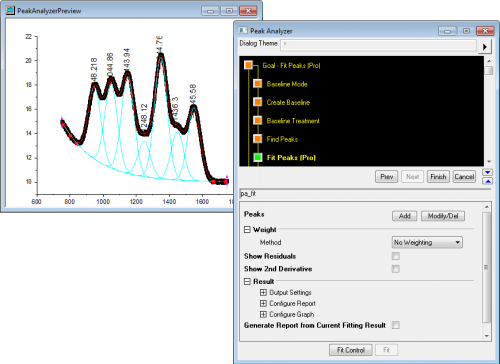
Origin's Peak Analyzer is a wizard for analyzing multi-peak data. The wizard guides the user through peak analysis process with a preview window to view step by step results. It provides a rich avenue of baseline correction methods and is ideal for analyzing a large number of peaks ("convoluted" and well separated). You can save the settings in each step as an analysis theme for batch processing similar data files.
Cons: The analysis procedure is relatively more complex than Quick Peaks Gadget and Multiple Peak Fit tool.
To Open Peak Analyzer Wizard
With data selected on worksheet or plotted on graph, go to menu Analysis: Peaks and Baseline: Peak Analyzer to open dialog.
Automating Peak Analyzer
Origin provides a Batch Peak Analysis tool that allows batch peak analysis on multiple datasets using an existing Analysis Template. Manually analyze a representative dataset in Peak Analyzer and save custom settings to a theme file. Use the theme file to perform batch analysis of multiple columns of data. OriginPro supports batch analysis with multi-peak fitting.
For more information, see these topics:
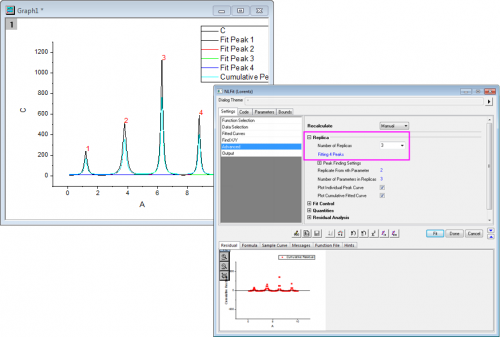
Besides commonly used peak analysis tools, you can also use Origin's Nonlinear Curve Fit tool to automatically locate multiple peaks and fit them as replicas. It is suitable for a small number of peaks that are well separated.
Cons: Do not provide baseline correction capability and cannot modify automatically detected peaks.
To Open Nonlinear Curve Fit Tool
With data selected on worksheet or plotted on graph, go to menu Analysis: Fitting: Nonlinear Curve Fit to open dialog.
|