8.4.2.1.10 The Rug TabAxesRef-Rug
To show the rug representation for a 2D XY plot in Cartesian coordinate, you can double-click on the X/Y axis to open the Axis dialog and then go to the Rug tab as below to do the customization.
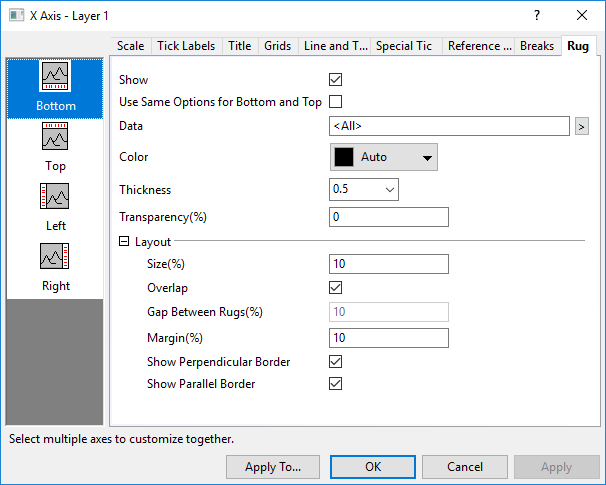
Show
This control can be used to show or hide the rug panel for current selected axis.
Use Same Options for Bottom and Top (Left and Right)
Check this box to use the same Rug options for both bottom and top (left and right) axis. When the box is checked, the Bottom and Top (Left and Right) options are shared. You only need to customize the bottom and left axis and the settings will be applied to the top and right.
Data
Select a plot to show its rug on current direction. By default, <All> will be selected to show rug for all plots on current direction. If you want to specify one single plot, you can click the arrow button beside the text box to select the plot from the context menu.
Color
Specify the color of the rug lines. By default, it has been set to Auto which means the color of rug will follow the color of the plot.
Thickness
Specify the thickness of the rug lines.
Transparency(%)
Specify the transparency of the rug lines. The value is in percentage within 0~100.
Layout
Customize the appearance of rug panel.
Size(%)
Specify the height of the rug panel.
You can set a value such as 50, then the height of the rug panel will be equal to [(Layer Width + Layer Height)/2]*50%.
To check the layer width and height, you can open the Size tab of Plot Details dialog.
Overlap
When there are more than one dataset on current direction, check this box to allow the rug lines of different datasets to be overlapped.
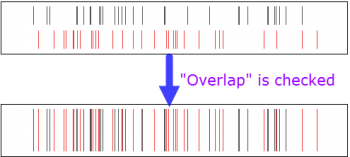
For all built-in rug templates, such as Scatter Rug, this check box is checked by default to overlap the rug lines of different dataset(all rug lines will be aligned).
If this check box is cleared, the rug lines of different datasets will be separated in the direction which is perpendicular to the axis.
Gap Between Rugs(%)
This option is only available when the Overlap check box above is unchecked.
Unchecked the Overlap check box, the rug lines of different dataset will be separated in the direction perpendicular to the axis. Then, you can enter a percent value(should be <100, such as 20) to set the gap for the different rug plots.
Set the height or width of rug panel to Size, then:
Gap = (Size - Size * Margin(%) *2) * Gap Between Rugs(%)
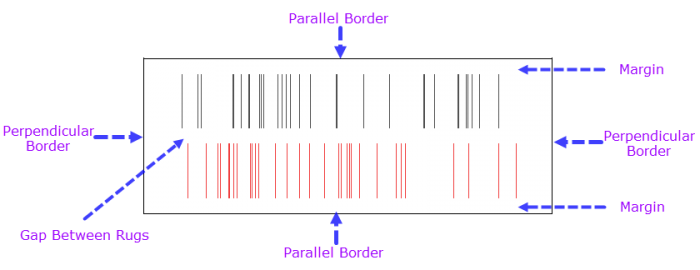
Margin(%)
This option is used to control the bottom and top margin of the rug panel, basing on the Size(%) option.
Please note, this value should be less then 50. Even if you can set it to 50 or larger value, Origin will still treat the value as 0.
Show Perpendicular Border
Specify whether show the Perpendicular Border.
Show Parallel Border
Specify whether show the Parallel Border.
|