8.4.2.3 Axes Dialog for Radar chartRadar-Axes-Dialog
This Axis Dialog is only for customizing axes and ticks for Radar Charts. Unlike the Axis Dialog for other plots, it can be used to control the axes including Radial Axes and Category Axes.
To open this Axis Dialog box, double-click on the Radar Chart graph axis or tick labels.
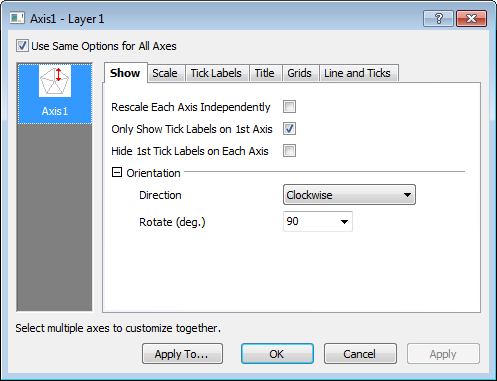
 | If you uncheck the Use Same Options for All Axes box in the upper-left hand corner of the dialog, you can customize each axis independently.
|
Show
Rescale Each Axis Independently
Rescale axes independently. When the Rescale Each Axis Independently and Use Same Options for All Axes boxes are both checked, the Scale node is disabled.
Only show Tick labels on 1st Axis
This box is checked by default. To show labels on all axes, clear the box.
To specify whether to show axis tick labels independently, clear the Use Same Options for All Axes check box (Only show Tick labels on 1st Axis becomes unavailable) .
Hide 1st Tick labels on Each Axis
When tick labels show on all axes, all starting tick labels will be in the center of the axes. To reduce clutter, you can select Hide 1st Tick labels on Each Axis check box to hide the first labels.
Orientation
| Direction
|
Specify the direction of rotation for the axis.
- Clockwise
- Counter-Clockwise
|
| Angle
|
Type or select the start angle for the first axis from this combination box. If the value is 0, the first axis will be positioned at 3 o'clock.
|
Scale
Specify the scale of the axis (axes).
The From, To, Type, Rescale and Rescale Margin(%) controls are identical to the Scale page in the standard 2D Axis dialog box. Those controls that differ are listed below:
| Major Ticks
|
Set the major ticks in the Radar axis(axes).
- By Increment
- Set the major ticks of this axis by increment specified in the text box below. Tick labels are placed at major tick marks. For example, type 10 to display a major tick mark at every tenth value.
- By Counts
- Set the total number of major tick marks displayed on this axis using the number specified in the text box below.
- Min & Max
- Only show the ticks at the minimum and maximum of the X scale.
|
| Minor Tick Count
|
Set the number of minor ticks displayed between major ticks specified in the Count text box. For example, select By Increment for Major Ticks, type 1 in the accompanying text box, then type 1 in the Minor Tick Count text box to set the minor tick increment to 0.5. One minor tick will display between each pair of major ticks.
|
Tick Labels
In this tab, you can customize the tick label display, format.etc for the selected axis(axes).
| Show Major Labels
|
Specify whether to show and how to show tick labels.
- None
- Both major and minor tick labels will not be shown.
- Before Axis
- Show major tick labels, and the labels will be shown before the axis following the flow direction defined in the Orientation tree node in the Miscellaneous page.
- After Axis
- Show major tick labels, and the labels will be shown after the axis following the flow direction defined in the Orientation tree node in the Miscellaneous page.
|
| Show Minor Labels
|
Specify whether to show minor tick labels. This check box is enabled when Show Major Labels is set to a value other than None.
|
| Display (subtab)
|
Customize tick label display. In this subtab, all available controls can be found in the help file of the standard 2D Axis dialog box.
|
| Format (subtab)
|
Customize tick label format. In this subtab, all available controls can be found in the help file of the standard 2D Axis dialog box.
As Radar has multiple axes and the axis line is not always horizontal or vertical as Cartesian coordinates, in the Offset in % Point Size branch, you are allowed to adjust the offset along the axis by the Parallel edit box and the offset perpendicular to the axis by the Perpendicular exit box.
|
Title
The title(s) for each radial axes will be shown at the axis end as a text label. By default the text for the title is retrieved from the corresponding X value. If you want to use a different title, you can modify the text label directly. To do this, double-click on the text label and enable "In Place Edit Mode".
| Show
|
Specify whether to show the title(s). If this box is cleared, all the other controls on this page will be disabled.
|
| Color
|
Select a title color from this drop-down list.
|
| Rotate
|
Origin supports arbitrary or automatic rotation of the title.
- Arbitrary Rotation:
- Select or enter a value. A positive value rotates the title counterclockwise; a negative value rotates the title clockwise.
- Automatic Rotation:
- When you choose the <auto> option, the axis title(s) are automatically rotated to be perpendicular to the corresponding axis.
|
| Font
|
- Font
- Select the title font in the drop-down list.
- Size
- Specify the size of the title of the axis in the combo box.
|
Grid
Under this tab, Major Grid Lines and Minor Grid Lines can be specified separately for the following.
| Show
|
Specify whether to show grid lines.
|
| Color
|
Select color of grid lines from this drop-down list.
|
| Type
|
Select the desired grid lines connection from this drop-down list.
|
| Thickness
|
Type or select the desired grid lines thickness from this combination box.
|
Line and Ticks
Line
Configure the lines of the radial axes.
| Show
|
Specify whether to show the axes.
|
| Color
|
Select line color from the drop-down list.
|
| Thickness
|
Type or select the line width from this combination box.
|
Ticks
Controls in this tree node are only available when the Show check box of the Line tree node is selected. Controls are identical to the Major/Minor Ticks tree node in the standard 2D Axis dialog box.
Reference Lines
Just as axes in the Cartesian coordinates, you can add reference lines on the axis of radar plot with the options in the Reference Lines tab.
About how the options work, you can refer to the Reference Lines tab of axes in Cartesian coordinates.
For a radar graph which only has one axis, the reference line will show as a regular polygon just as the grid lines.
Apply to Others
Click the Apply To... button to open the Apply To dialog. This dialog can be opened by clicking the Apply To... button at the bottom of the Axis dialog. You can specify format of Tick Labels and Line and Ticks, and Grib Lines to apply from source axis to objective axis.
This dialog works similarly with the Apply to Others page in 2D graph Axis dialog.
|