8.3.2 Adding or Swapping Data Plots in the Graph LayerDataPlot-Manage
Typically, Origin graphs are created by (1) selecting data and (2) clicking on a toolbar button or Plot menu command. Eventually, you may encounter situations in which you would like to manually add or remove one or more data plots in an existing graph and these procedures are discussed below.
Adding Plot into a Graph Layer with the Insert Plot to Layer Menu
This method supports only Line, Scatter, Line + Symbol, Column (or Bar) or Area plots. This is a straightforward method for adding selected worksheet data to the active graph layer. If you select multiple Y datasets (columns), the data are grouped in the layer and plot characteristics automatically increment by dataset.
To add a range of data to an existing line, scatter, line + symbol, column or area graph:
- Highlight your worksheet data.
- Click on the graph window to activate it.
- From the Origin menu, choose, Insert: Plot to Layer: Graph Type.
|
Note: If you want more control over the way in which plots are added to the layer -- being able to group the plots in the layer, for instance -- you can set a LabTalk system variable that will link the Add Plot menu command to the Plot Setup dialog box (note that there are other ways to open the Plot Setup dialog box).
To modify the behavior of the Plot to Layer menu command in the current session only, open the Command Window and at the command line type one of the following:
@LIP=0 <ENTER> //The Plot Setup dialog opens.
@LIP=1 <ENTER> //DEFAULT -- Selected datasets are added to the layer without opening the Plot Setup dialog box.
To make your change stick across Origin sessions, use the Set System Variables dialog box.
|
Adding a Function Plot or Parametric Plot into Current Layer
Since Origin 2019b, Origin supports to add a function plot or parametric plot into current 2D/3D graph layer directly by select Insert: Function Plot or Insert: Parametric Plot menu.
Once you selected the Insert: Function Plot or Insert: Parametric Plot menu, the Create Function Plot dialog will pop up. Enter the function definition and click Add button will insert the function plot into current graph windows.
To further customize the function plots you can In the Function tab, you can open the Function tab of the Plot Details dialog.
Dragging Selected Data into the Graph Layer
You can create simple 2D plots by dragging and dropping selected worksheet data onto an Origin graph window. Note that this doesn't work for graphs which require Origin to do some behind-the-scenes calculating, as is the case with statistical chart types.
To learn more, see the topic Adding Data by Drag and Drop.
Adding Data into the Graph Layer by Copying and Pasting a Plot
With many Basic 2D graphs (e.g. Scatter, Line, Line + Symbol, Bubble, etc.), you can copy a plot from an existing graph layer and paste it to another layer in the same window or into a separate graph window. Prior to Origin 2020, this would only produce a black line plot. Origin 2020 expanded copy-paste of plots to other plot types, while preserving plot properties (symbol size, color, etc.).
- Click on the plot to select it and press CTRL+C.
- Click on the target graph and press CTRL+V.
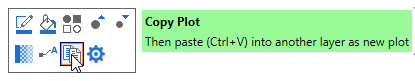
You can also copy a plot by selecting the plot in the graph and clicking on the Copy Plot button on the mini toolbar.
 | Previous versions also allowed you to select and copy a simple plot (Line, Scatter, Line + Symbol, 2D Column/Bar) and paste underlying data into a worksheet. The default settings no longer support this but you can reverse this by setting LabTalk system variable @CPNP=1.
|
Managing and Editing Plots in Layer using the dialogs
The Layer Contents dialog box
The Layer Contents dialog box is useful for:
- Easy adding and removing of datasets (data plots) from the active graph layer
- Filtering the list of available data, and sort by book, sheet, or long name etc to easily locate desired datasets
- Changing the order of datasets in the layer (affects plot drawing order)
- Grouping (or ungrouping) of datasets
- Editing the plot range
To learn more, see The Layer Contents Dialog Box.
The Plot Setup dialog box
The Plot Setup dialog box provides a flexible interface for:
- adding or removing of datasets (data plots) from any layer in the graph window
- specifying or modifying the plot type
- grouping (or ungrouping) of datasets
- editing the plot range
To learn more, see The Plot Setup Dialog Box.
Managing Plots with Object Manager
Once a graph is created, all plot elements will be listed as a tree-node structure in the Object Manager to help you manage the graph objects interactively.
With the Object Manager, you can
- Hiding/Showing plots
- Moving plots within the group/layer
- Moving plots between groups or between layers
- Removing a plot or special points
- Changing plot type quickly
- Switching to the Plot Details, Layer Content, and Plot Setup dialog
- Changing layer order and drawing order
To learn more, see the Object Manager.
Directly importing ASCII data into a Graph Layer
It is also possible to import an ASCII file directly into a graph window. This works only for a few simple plot types (line, line + symbol, column and bar). To learn more about this method, see Adding Data by Direct ASCII Import.
Changing the datasets associated with a plot
Changing the datasets in the same worksheet
Active the plot to change dataset
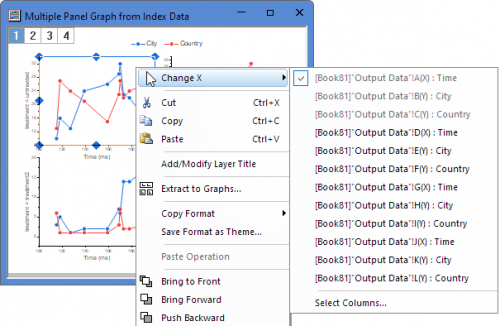
You can change datasets associated with a plot, using a context menu command:
- Click on the plot to select, then right-click and point to Change X/ Change Y/ Change Z(only for 3D and Contour Graphs).
- Choose another column from the original worksheet; or click Select Columns to open the Column Browser and select another column in Current Folder, in Current Folder (recursive) or in Current Project.
Note that you can override the original column plot designation using this method (e.g. you could point to Change X and select a worksheet column that was designated Y).
Right click the Layer or outside of Layer frame to change X
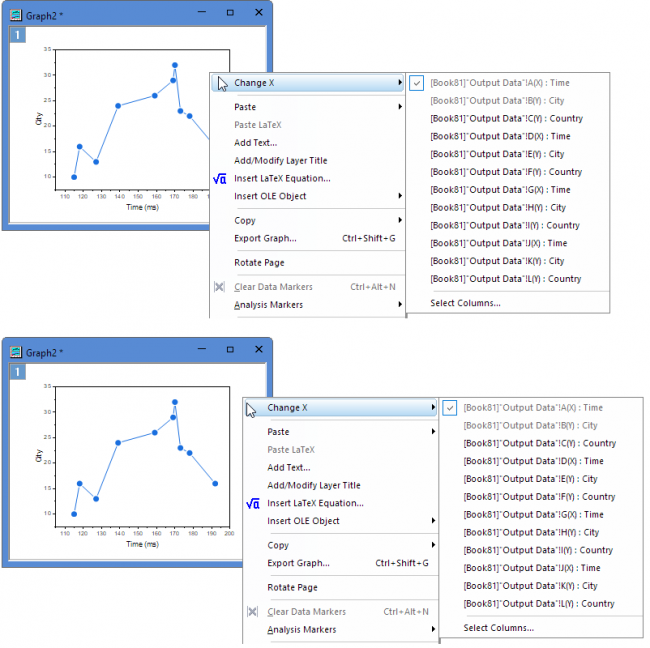
- When there is a plot in a graph with only one layer, right-click on the blank area within layer or outside the layer frame, you can select Change X to change X for the plot.
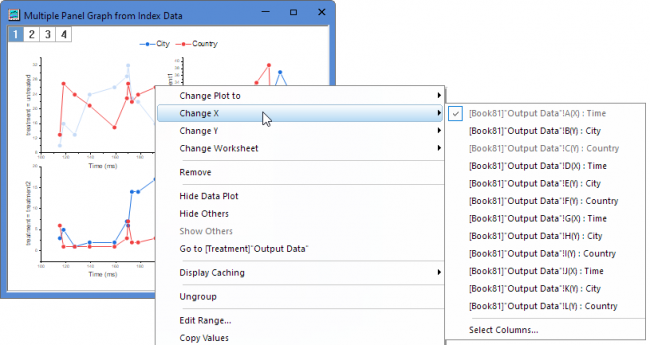
- When there is a plot in a graph with multiple layers, active the layer and right-click on the blank area within layer you can select Change X to change X for the plot.
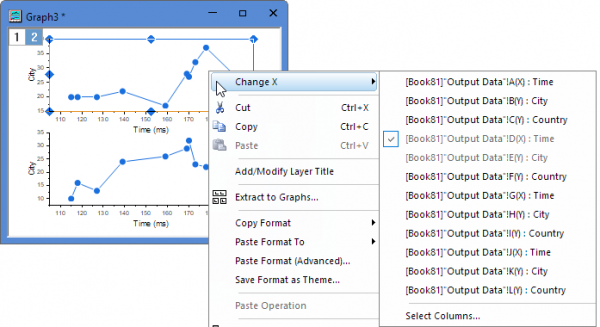
- If there are multiple plots created by the same X dataset in a layer, above two methods are also available. This is useful for batch changing X for multiple plots created by the same X in a layer.
Changing the datasets in another worksheet
If you have multiple workbooks, each of which has a worksheet with ...
- identical sheet short names
- identical column short names
- identical column plot designations
- matching column indexes
... you can swap plots by choosing another workbook.
- To choose from datasets in another workbook, click on the plot to select, then right-click and point to Change Worksheet.
|