2.1.7 Object ManagerObject-Manager
Object Manager Overview
The Object Manager is a dockable panel that opens to the right side of the workspace, by default. Object Manager helps you quickly manipulate the current active window.
- Select View: Object Manager from the main menu. Or, press Alt + 8 hotkey.
- Right-click the Object Manager title bar to auto float, dock, hide or auto hide the window.
- Double-click on the title bar can also dock or float Object Manager.
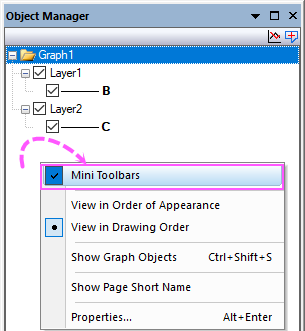
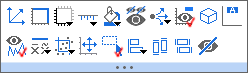
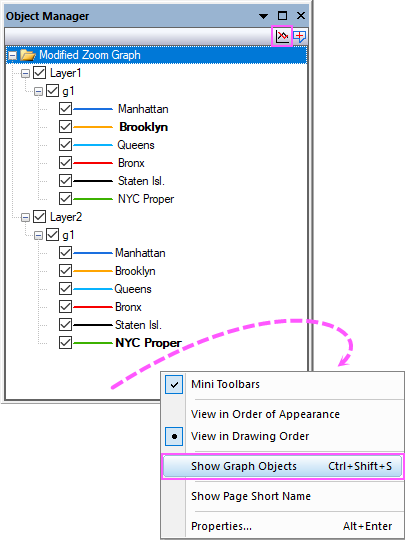
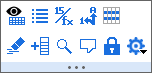
- Right-click the white space in Object Manager to select the option Mini Toolbars.
- When active the Graph/ Workbook/ Layout windows, adds/ hides/ shows Notes window for the page by clicking the Add Notes
 / Hide Notes / Hide Notes  / Show Notes / Show Notes  at the right-top corner of the Object Manager at the right-top corner of the Object Manager
Manage the Data Plots or Graph Objects in the Active Graph Window
Manage the Data Plots
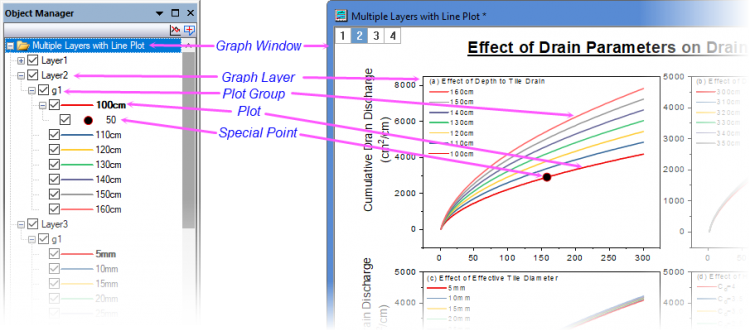
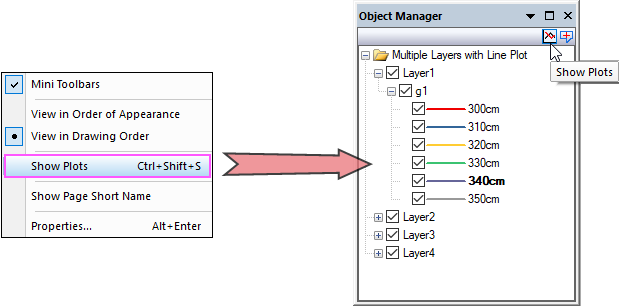
By default, Show Plots mode is on with Show Plots button  showing. Object Manager is a single-panel window showing what plots are contained in the graph window -- layers, plot groups (if any), plots and special points (if any), in a tree-node structure. showing. Object Manager is a single-panel window showing what plots are contained in the graph window -- layers, plot groups (if any), plots and special points (if any), in a tree-node structure.
- (a). Every plot item consists of a symbol icon (a color scale thumbnail if contour or colormap surface) and the plot name that follows.
- (b). The plot name is programmatically linked to the source data like Graph Legend.
 | When customize the legend with custom syntax in text object Properties dialog or Plot Details dialog, Object Manager also will display exactly the same as the legend on the graph.
|
Manage the Graph Objects
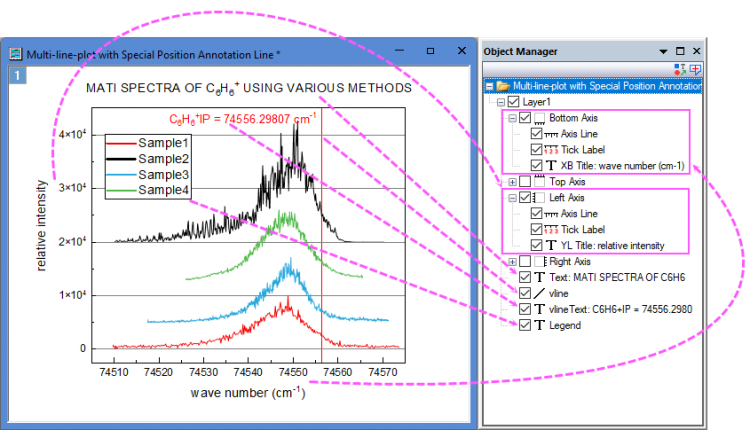
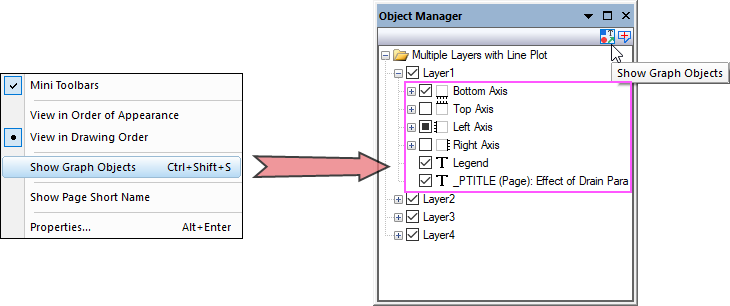
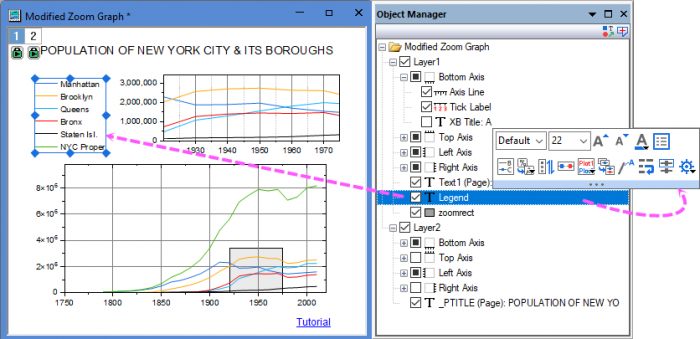
Switch to Show Graph Objects mode by clicking the Show Graph Objects button  . Object Manager will show what graph objects are contained in the graph window -- layers, Axes, graph objects (axis title, legend, text or draw objects etc..), in a tree-node structure. . Object Manager will show what graph objects are contained in the graph window -- layers, Axes, graph objects (axis title, legend, text or draw objects etc..), in a tree-node structure.
Note:
- All text objects will display their contents, with the maximum text length specified by the system variable @OMTL(the default value is 20 characters).
- All Axes will be listed as tree nodes which include Axis Line, Tick Label and Axis Title. To show or hide the axes or axis elements, you can check or uncheck the check boxes before the nodes.
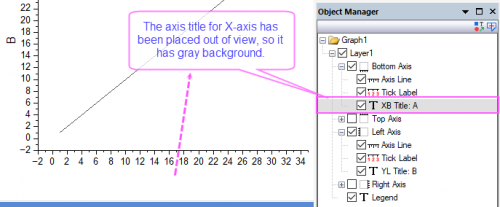
- When an object is out of sight(e.g. outside of Page area), the object will show with gray background in Object Manager.
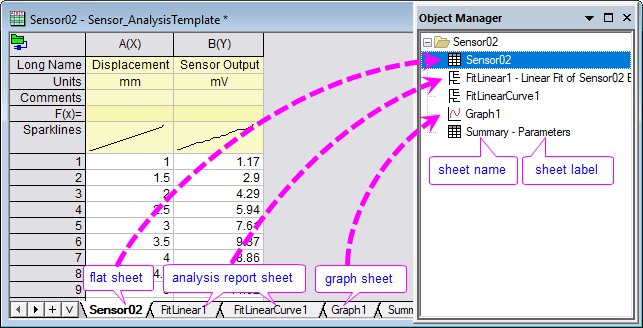
Manage the Sheets in the Active Workbook and Matrix Window
It is a one panel window showing what are contained in the workbook/matrix window -- booksand sheets, in a tree-node structure. The workbook short name and sheet's name and label will be listed.
Interaction between Object Manager and Graph Window
Switch the View Mode
View Modes: Show Plots or Graph Objects
- Show Plots: Show the plots in current graph. In the upper right corner, there is a small button Show Plots to display the View Modes status. (By default)
- Show Graph Objects: Show the graph objects including drawing objects, text object, legends, color scale and axis titles and so on. In the upper right corner, there is a small button Show Graph Object to display the View Modes status.
- Right-click on the white space or right-click on the graph node in the Object Manager to select Show Graph Objects or Show Plots to switch the view mode.
- Click the small button or in the upper right corner to switch the view mode.
- Press hot key Ctrl+Shift+S to toggle the status
View Modes by Orders
Right-click on the white space under the plots or right-click on the graph node, you can choose View in Order of Appearance or View in Drawing Order to change the view mode of plots in current graph:
- View in Order of Appearance: View the plots in the order of appearance in graph.
- View in Drawing Order: View the plots in the drawing order.
"Show Plots" Mode: Operations on Plots
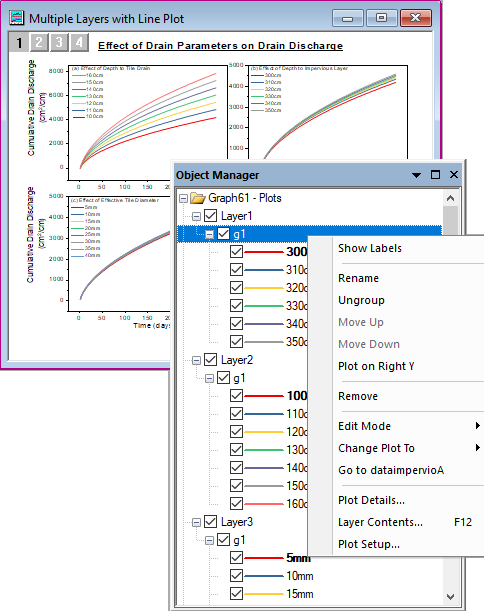
Right-click on a plot or multiple selected plots within a group in Object Mananger, you will see some specific operations in the context menu.
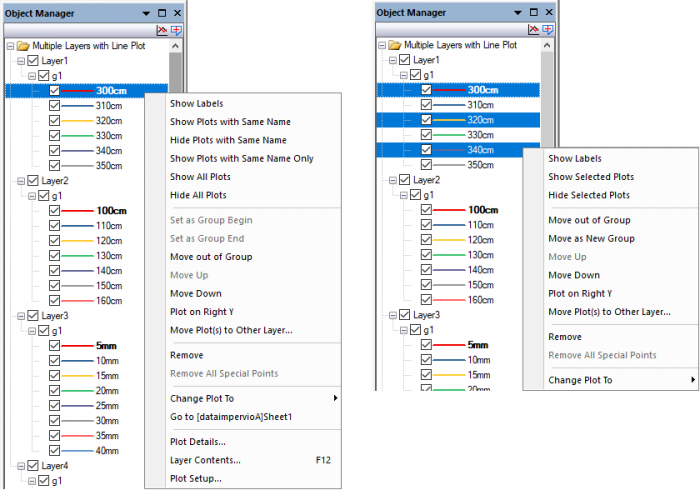
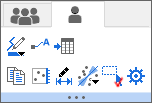
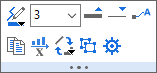
Once you have enabled Mini Toolbars, click on a plot, you will see the related mini tolbar popup. For example, selecting a line plot within a group will popup the mini toolbar below:
Select a graph element
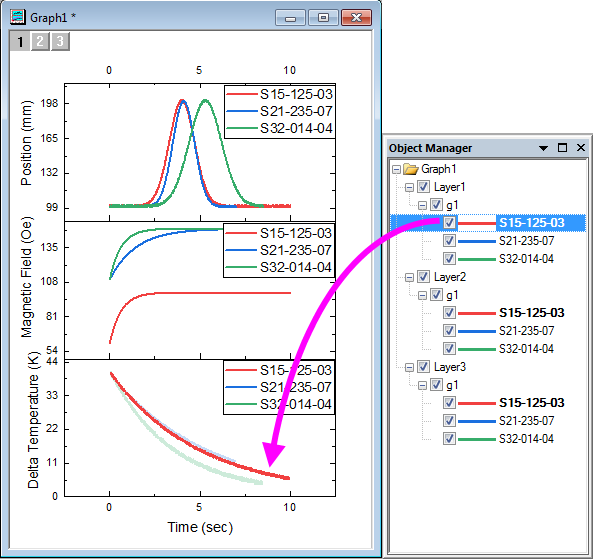
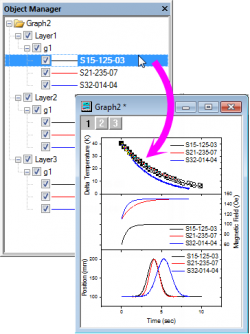
Select an element (layer, group, plot or special point) in the Object Manager to select the corresponding element in the graph window and vice versa. Note: If a plot is part of a plot group, clicking once on the plot selects the group; clicking a second time selects the individual plot.
For a graph layer with Scatter, Line or Line+Symbol plots, selecting a single plot in Object Manager as shown below, will fade the other plots in the layer. Conversely, if you select a single plot in the graph window, other plots in the layer will be faded (see the Note below on @PSFF).
-
- In the Object Manager, you can move the selection using the up and down arrow keys; in the graph, move plot selection using the left and right arrow keys.
- You cannot select error bars separately, and if you select a plot which has error bars, the error bar fade will follow the parent plot.
- When there are multiple layers, Origin will check if the layers are overlapped. When you select a plot, Origin will fade out all other plots, including plots in the overlapped layer(s). Plots in layers that are not overlapped will not be faded.
- When you select a plot, this plot becomes the active plot.
- You are only allowed to select single one plot at one time, even though you are using the hot keys "Ctrl+click" and "Shift + Arrow key" like in the Object Manager panel of a workbook window.
- When you select a group in Object Manager (denoted by gN in the Object Manager), all plots within it will be highlighted by showing a sampling of data points in bold. You can use the system variables @DTB to set the number of highlighted data points of each plot.
Note: You can use the system variable @PSFF to set the degree(in %) of fading out for the unselected plots. The default value is 25, setting to a negative value will turn off the fade-out selection mode and go back to the old selection behavior (showing a sampling of data points in bold) as below:
|
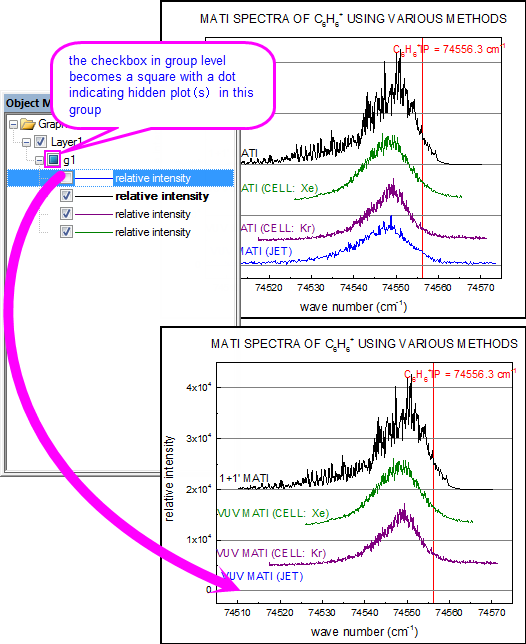
Hide/Show plots
- Hide/Show an element (layer, group, plot, special point and graph objects) by deselecting/selecting the checkbox before the item.
-
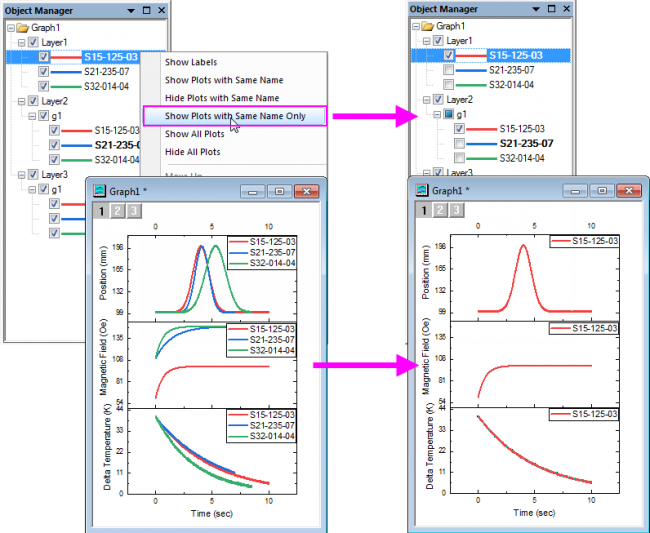
- Hide/Show a set of plots with the same name by right-clicking on one of the plots and selecting Hide/Show Plots with Same Name.
- Show a set of plots with the specific name only and hide all others by right-clicking on one of the plots and selecting Show Plots with Same Name Only.
-
- Show all plots in the graph by right-clicking on any of the plots and selecting Show All Plots.
- Hide all plots in the graph by right-clicking on any of the plots and selecting Hide All Plots.
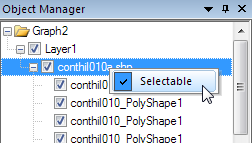
| When working with imported shapefiles (.shp), you can make shapefile features (points, polylines, polygons) selectable in the graph window and in the Object Manager by right-clicking on a component and placing a check mark beside Selectable. To prevent a component from being selected, clear the check mark.
|
Rename Matrix Object / Virtual Matrix Z title
The Long Name of Matrix Object / Virtual Matrix Z title can be customized by Object Manager for the graph.
Create a Contour / 3D plot by Matrix or Virtual Matrix. When the graph window is active, right-click on the plot in the Object Manager and select Rename from the context menu, then you can enter the Long Name for the Matrix Object or Virtual Matrix.
Note: Here rename the Long Name of Matrix Object or Virtual Matrix, but not the Graph Long Name.
To rename the Matrix Object, you also can use the Matrix Properties dialog
To rename the Virtual Matrix, you also can use Virtual Matrix Manager dialog
Moving plots within the group
The drawing order in the layer is determined by the order of the plots in the Layer Contents - Plot Setup - Object Manager list. The plots are drawn following the list order; the first plot at the top of the list is plotted first and the bottom one plotted last. Thus, drawing order has implications for overlapping plots as well as assignment of plot styles by increment list in grouped plots.
- Select a plot, right-click and select Move up or Move Down to move the plot up and down in the list, including within a group (i.e. beneath a gN element). To keep the symbol/line color of a plot when moving it up or down inside a group, right-click on the group node (e.g. g1) to select Edit Mode: Independent before re-ordering the plots.
Moving plots in or out of Current group; Adding a New Group
Use the following Object Manager shortcut commands to create a new group or to remove plots from a group:
- Set as Group Begin: Group this plot and the plots "below" selected plot as a new group. Plots above this plot will keep the original group.
- Set as Group End: Group the plots "below" selected plot as a new group. This plot and plots above this plot will keep the original group.
- Move out of Group: Move the selected plot out of the plot group. This does not remove the plot from the graph window; to do that use Remove.
- To move plots between groups (within or between layers), simply drag plots in the Object Manager. Note that you cannot drag a plot to an empty layer (see Moving plots to other axes or layers).
Plot On Right/Left Y
Beginning with Origin 2023, you can add a right-Y axis without having to add a layer to the graph. There are three ways to do this, two of which involve the Object Manager:
- Use Plot Details controls to turn on another Y axis(right or left) and assign one or more plots to the axis.
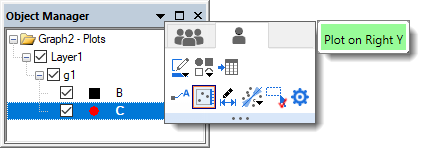
- In Object Manager, highlight the plot icon that you want to plot against the right-Y and (a) right-click on the icon and from the shortcut menu, choose Plot on Right Y; or (b) click the Plot on Right Y button on the Mini Toolbar.
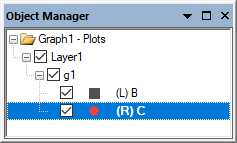
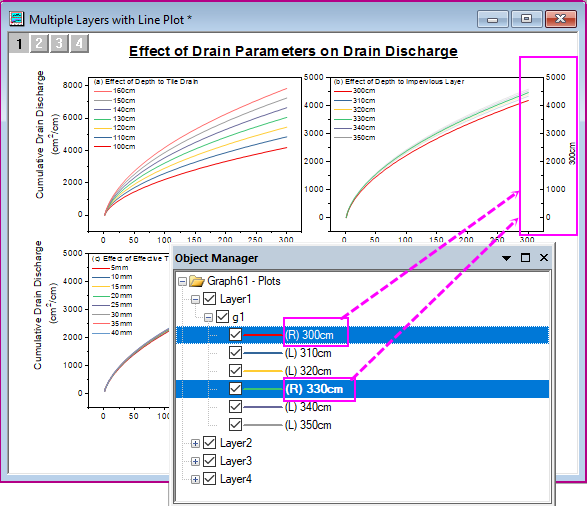
When a right-Y axis is added to the layer, data that plot against the right-Y axis will display an (R) preceding the dataset name; those plotted against the left-Y will show an (L) preceding the dataset name.
Moving plots between layers
- Plot On Right/Left Y: Use this Object Manager shortcut command to simultaneously show the right/left Y axis and move the selected plot to that axis. This behavior won't create a new layer, but just show the second Y axis of current layer and make the plot base on it. Once both left and right Y axes show, there will be a label (R) or (L) before the plot name to mark the axis the plot basing on.
- Move Plot(s) to Other Layer: Use this Object Manager shortcut command to move the selected plot to another layer. Selecting this shortcut menu will open the Move Plot : laymplot dialog. In this dialog, you can specify the plot(s) you want to move, the target layer and settings of new layer.
Note that in some situations, you can simply drag plots between layers but when this is not supported, you can use this menu command to add the selected plot to the layer.
Remove a plot or Remove Special Points
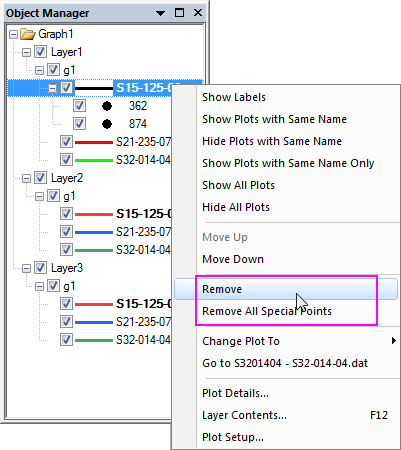
- You can remove a plot from the graph by right-clicking on the plot and selecting Remove from the context menu. The plots below the removed plot will move up and be assigned new plot indexes. Note that Remove removes the plot from the graph. If you only wish to hide a plot temporarily, choose Hide Data Plot in the graph window or clear the check box beside the plot in Object Manager.
- You can remove all special data points in a plot by selecting Remove All Special Points from the context menu.
- To remove special points individually, right-click on one special point and choose Remove from the context menu; or simply select the special point in the plot or in Object Manager and press DELETE.
Change plot type quickly
- To quickly change a plot type, select the target plot item, right click and select Change Plot To: desired plot type.
Go to the source workbook
- To activate the source workbook of a plot, select the target plot item, right click and select Go to source workbook.
Open the Plot Details, Layer Content, and Plot Setup dialog
- Context menus at graph, layer and plot levels provide options to open the Plot Details, Layer Content and Plot Setup dialog. The active level/plot in the dialog that opens varies depending on the level/plot item you have right-clicked at.
-
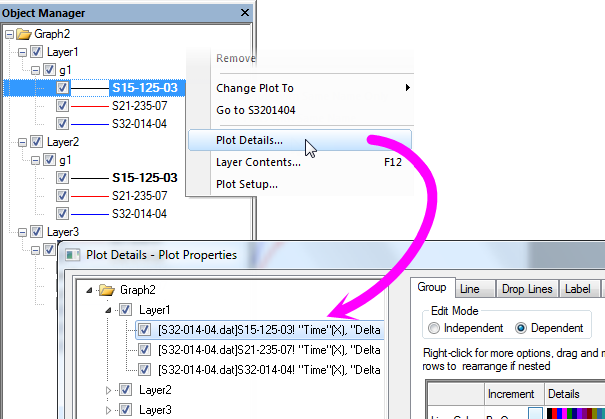
| To open the Plot Details dialog, you can also double click on an item to open the dialog with that item selected.
|
"Show Plots" Mode: Operations on a group
There are some specific operations for a group. You can right-click on the group row to show the context menu:
Once you have enabled Mini Toolbars, click on the group row, you will see the mini toolbar below:
Rename a group
Right-click on a group to select Rename. The group name (Long Name) is in edit mode. You can then enter a new name. This group name will show in the plot list at the bottom of Data main menu and also show as tool-tip in the Layer Content dialog when mouse hovers over the group column.
Ungroup the plots
Right-click on a group to select Ungroup to ungroup all plots under current group.
To re-group these plots or group some sequential plots, right-click on the first plot you want to group, select Set as Group Begin context menu, then all the subsequent plots will be grouped up with this first plot.
Reorder the grouped plots
Although the plots under a group are treated as a unit, you are allowed to reorder them by right-clicking on a plot and selecting Move Up and Move Down context menu.
Remove a group
Right-click on a group to select Remove to remove the whole group pf plots from current layer. You can select Edit: Undo main menu or press Ctrl+Z hotkey to undo the deletion.
Change the edit mode for grouped plots
Right-click on a group to select Edit Mode: Dependence or Edit Mode: Independence to change the edit mode of the plots under this group.
Change plot type for grouped plots
Right-click on a group to select Change Plot to: ### to change the plot type of current group.
Go to Source Book
Go to the source workbook or matrix book of plots in current group.
Go to other related dialogs
Right-click on the group to select Plot Details... or Layer Contents... or Plot Setup... context menu to switch to other related dialog.
"Show Plots" Mode: Operations on One Layer
There are some specific operations for a layer. You can right-click on the layer node to show the context menu:
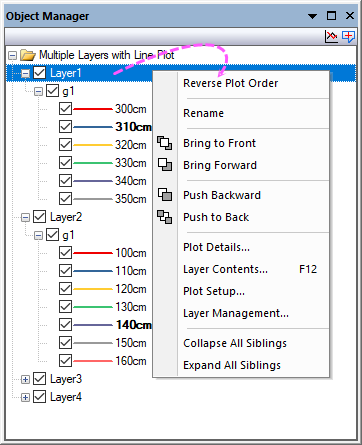
Once you have enabled Mini Toolbars, click on the layer, you will see the mini toolbar below:
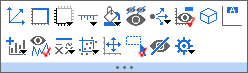
When multiple layers have been selected, the mini toolbar will show as below:
Reverse Plot Order in a layer
Once you plotted multiple plots in a layer, you can right-click on the Layer node in Object Manager to select Reverse Plot Order to reverse order for all plots in current layer.
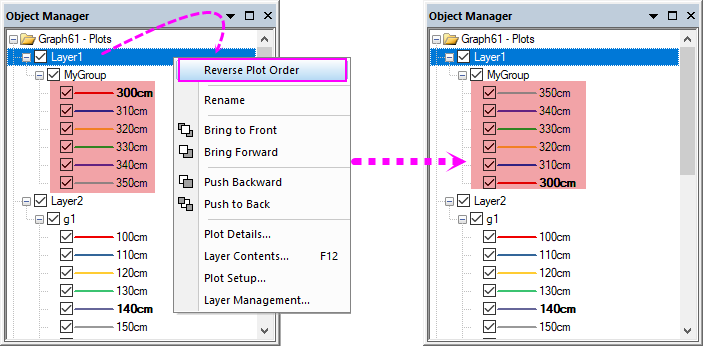
Please note, Origin will keep plot properties for grouped plots when reverse order. So when the increment property of the grouped plots is not none, we should update the increment list so each plot has the same style after the plot order has been reversed.
Rename the Layer
You can select Rename from the context menu to change the layer name, and the layer index will be kept.
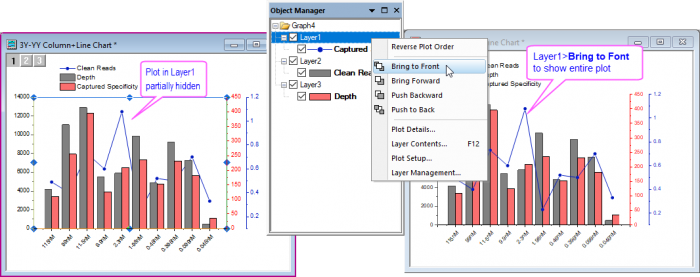
Change Layer Order and Drawing Order
When you click on a layer in Object Manager, the layer will be selected in the graph (selection handles in graph not shown for clarity). You can use the context menus, Bring to Front, Bring Forward, Push Backward or Push to Back, to adjust the drawing order of the layers.
| A couple of things to note:
- Reordering linked layers may produce an attention message about breaking links to parent layers. For purposes of reordering layers, you can safely break existing links as long as you do not subsequently change things such as relative layer positions or axis scales.
- Apart from layer order, drawing order can be affected by the Drawing order setting on the Layers tab of Plot Details. See this page for more information.
|
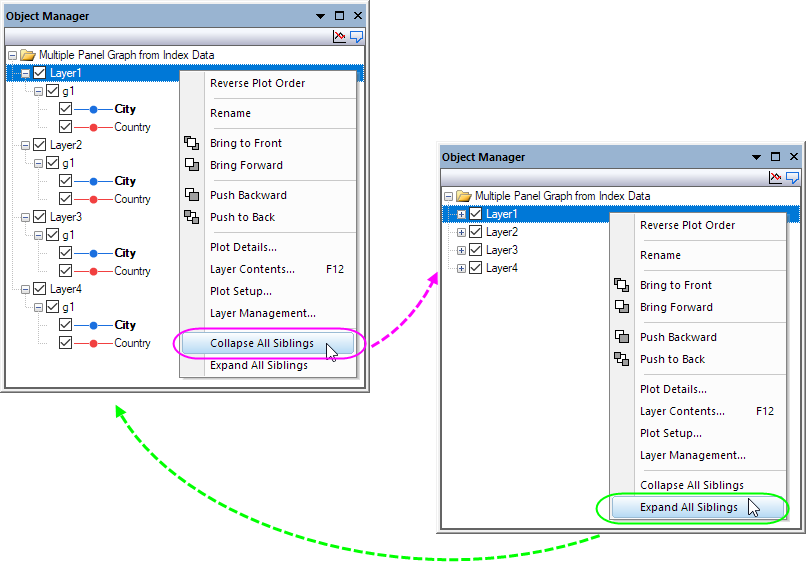
Collapse/Expand All Siblings
You can collapse or expand all plots under all layers by selecting the context menu Collapse All Siblings or Expand All Siblings.
"Show Graph Objects" Mode: Operations on Graph Objects
To manage the graph objects in the Object Manager, right-click on the white space or right-click on the graph node in the Object Manager, and then select Show Graph Objects from the fly-out menu; Or click the Show Plots button to switch the view mode.
Note: Once you have enabled Mini Toolbars in the fly-out menu, click on a object, you will see the related mini toobar pop-up.
Select a Graph object or Multiple Objects
Select a graph object
Select a graph object in the Object Manager to select the corresponding graph object in the graph window and vice versa. The mini toolbar will also pop up to let you customize the object quickly.
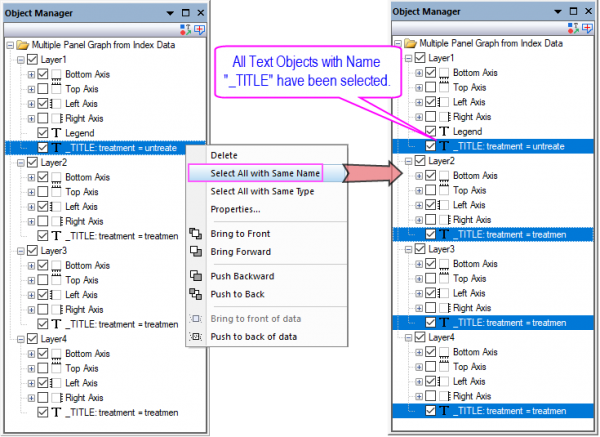
Select all objects with same name
You can use the context menu Select All with Same Name to select all objects with same name type in current page. And once all those objects have been selected, click on one of it, the mini toolbar should popup to let you customize them together.
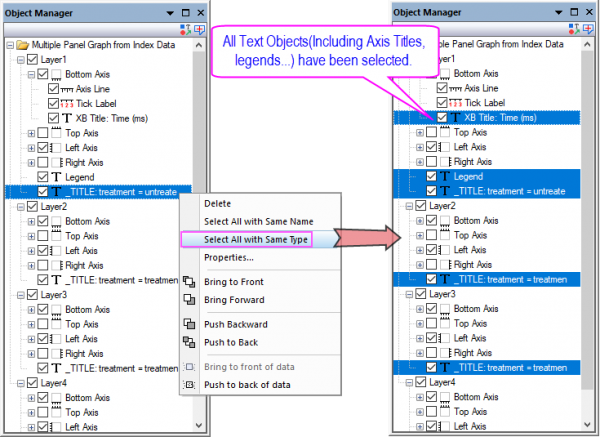
Select all objects with same type
You can use the context menu Select All with Same Type to select all objects with same type in current page. And once all those objects have been selected, click on one of it, the mini toolbar should popup to let you customize them together.
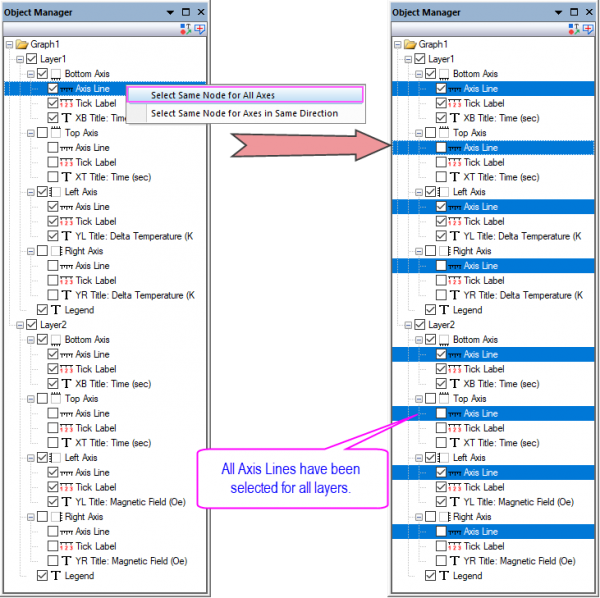
Select Same Node for All Axes
As all axis elements are listed as nodes for each layer, you can right-click on an axis or axis element to select Select Same Node for All Axes context menu to select same nodes for all axes in all layers.
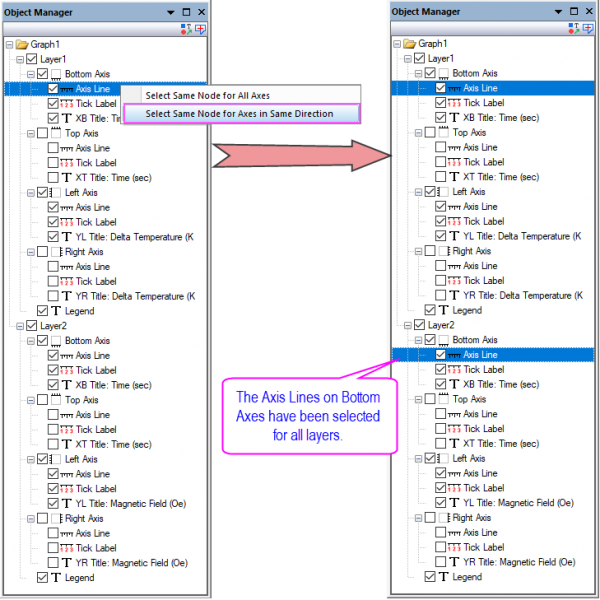
Select Same Node for Axes in Same Direction
As all axis elements are listed as nodes for each layer, you can right-click on an axis or axis element to select Select Same Node for Axes in Same Direction context menu to select same nodes for the axes in same direction in all layers.
Select Multiple Objects with Ctrl or Shift Key Pressed
With Ctrl / Shift key pressed, click on multiple layers/plots/graph objects to select them and then you can customize them at the same time.
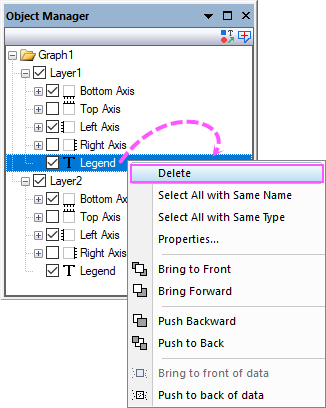
Delete a Graph Object
To delete a object(not axis or axis element), right-click on it to select Delete context menu.
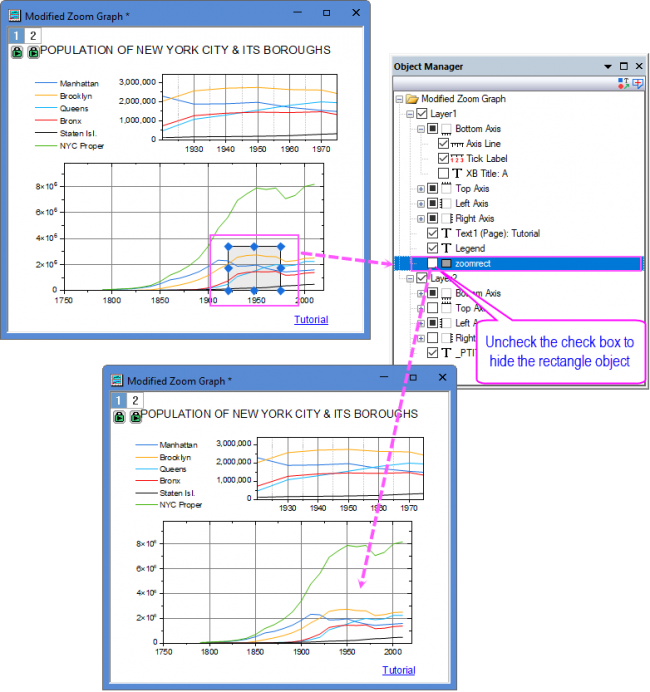
Hide/Show a graph object
Hide/Show a graph object by deselecting/selecting the checkbox before the item.
| To hide/show the same type objects in all layers.
- In the Show Graph Objects mode, right click on the object and choose Select all objects with same type
- Use the Mini Toolbar button
 to turn on/off objects of same type. to turn on/off objects of same type.
|
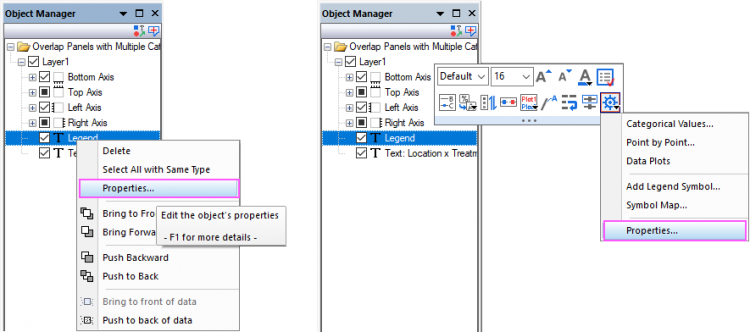
Edit the Object Properties
To open the from Object Manager, you can choose one of these tree ways:
- Double-click on the item of graph object in the Object Manager
- Right-click on the a graph object in the Object Manager and select Properties in the context menu
- Click the mini toolbar button
 or Properties... fly-out menu under this mini toolbar button. or Properties... fly-out menu under this mini toolbar button.
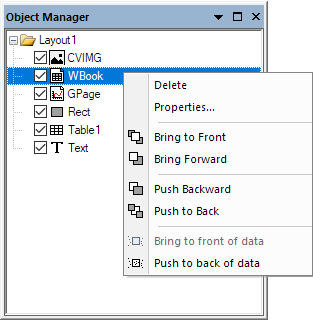
Change the graph object order
You can use the context menus, Bring to Front, Bring Forward, Push Backward, Push to Back, Bring to front of data and Push to back of data to adjust the graph object order of the layers.
Or, just drag and drop the object to the position you want. Please note, axis nodes are not allowed to be dragged.
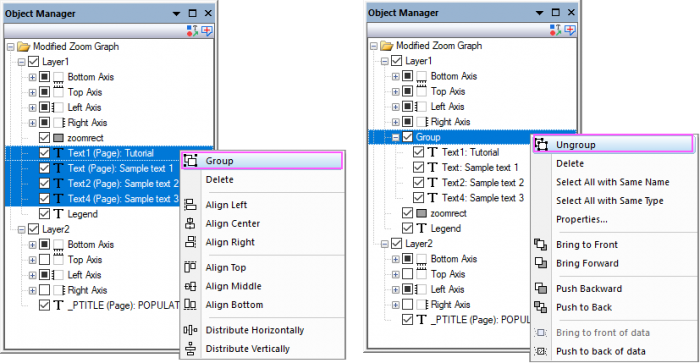
Group/Ungroup Multiple graph objects
With Ctrl key pressed, select multiple graph objects in the Object Manager, right-click on them, and select Group to group the selected objects.
To ungroup the objects, right-click on the Group node and select Ungroup.
Alignment Multiple Graph Objects
You can use the context menus, Align Left, Align Center, Align Right, Align Top, Align Middle, Align Bottom, Distribute Horizontally and Distribute Vertically to align multiple graph objects. The mini toolbar button  and the button in the Object Edit Toolbar can also be used to align the objects. and the button in the Object Edit Toolbar can also be used to align the objects.
Examples: Select objects and customize them
- Select and customize multiple layers
- Select and customize multiple plots
- Select and customize multiple graph objects
Interaction between Object Manager and Book Window
Since Origin 2020, Object Manager also lists all sheets in current workbook/matrix, and supports to interact with a workbook or matrix window at the sheet-level.
Once you have enabled Mini Toolbars during a graph window activated, when you activate a workbook and click on a sheet in Object Manager, you will see the mini toolbar below:
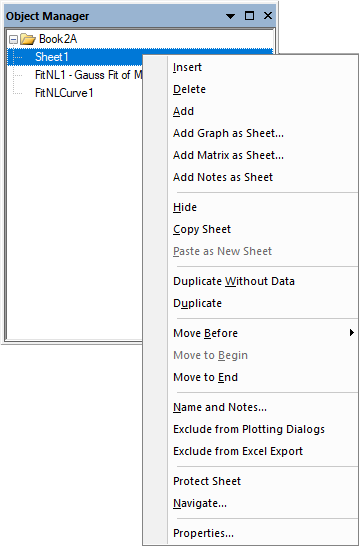
Right-click on any sheet, you can perform the basic operations on the sheet from the context menu, like the basic operations performed by selecting the context menu items on the worksheet tab itself.
- Select a Sheet.
- You can click a tree node to select a sheet in the workbook or matrix window. Click on the Book node to activate the first sheet. Please note, double-clicking on the book node can open the Window Properties dialog.
- Select multiple sheets
- You can make multiple selection by pressing Ctrl key and clicking sheets one by one. And, you can select multiple sheets by pressing Shift key meanwhile using the Arrow (up or down) key.
- Insert, Add and Delete a Sheet
- Right-click on any sheet node, you can insert a new sheet above, delete current sheet or add a new sheet at the last.
- Add Other Windows as a Sheet
- Add Graph as Sheet, Add Matrix as Sheet or Add Notes as Sheet.
- Hide/Show a Sheet
- Right-click on a sheet to select Hide to hide the sheet; and right-click on a hidden sheet to select Show to show it.
- Copy and Paste a Sheet
- Right-click on the sheet tab and selecting Copy Sheet and Paste as New Sheet context menu item.
- Duplicate a Sheet
- You can select Duplicate Without Data or Duplicate to duplicate the current worksheet with data or without data
- Move and Reorder the Sheets
- You can drag&drop the sheets to reorder them, or use the Move menu items to re-arrange them.
- Comment a Sheet
- You can open the Name and Notes dialog to set the name and comments for current sheet.
- Exclude a Sheet from Plotting Dialog and Excel Export
- You can exclude some sheet to prevent them from being included in Plotting dialog and Excel Export dialog
- Protect a Sheet
- Right-click a sheet to select Protect Sheet to open the Protect Sheet Options dialog to decide how to protect sheet contents.
- Navigate Sheets
- Right-click a sheet to select Navigate to open the Navigate Worksheets or Naviaget Matrix Sheets dialog to navigate all sheets in current book.
| Starting with Origin 2022, you can add color to sheet tabs. When you do this, Object Manager marks sheets with the tab color.
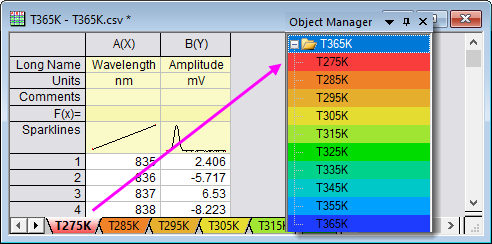
|
Named Data Ranges in Object Manager
Named ranges list under the worksheet in which they are defined.
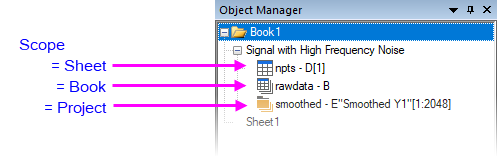
- The assigned range appears beside the range name.
- The named range icon indicates scope.
- A single-click on a named range will highlight the assigned range in the worksheet.
- Double-clicking will open the Named Range Manager with the named range highlighted.
Interaction between Object Manager and Layout Window
Object Manager lists all objects in current Layout window, and supports to interact with a objects.
About interacting with objects, please refer to the Graph Objects section in this page.
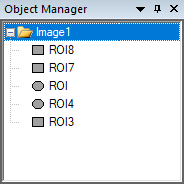
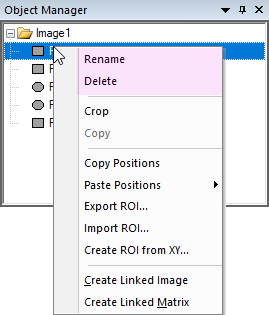
Interaction between Object Manager and Image Window
Object Manager lists all ROIs on current Image window, and supports interacting between the Image window and Object Manager.
- Mini Toolbars is enable by default. When you click on the Image window name in Object Manager, you will see the window-level mini toolbar:
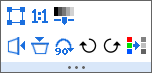
|