8.3.9 Batch PlottingGraphing-Batch-Plotting
In Origin, there are several ways in which you can customize a graph, then reuse those customizations with other datasets.
To make use of graph templates and graph Themes, you must have previously saved a group of customizations to file. Copy/paste formats and batch plotting do not require pre-saving a file. All have their applications but batch plotting is especially useful when working with multi-column/sheet/book data. In this section, we will discuss how to do batch plotting with new columns/sheets/books having an identical structure or matched identifiers to the original column/sheet/book data.
Supported graph types
- Batch plotting is only available for 2D/3D/Contour graphs in the same project and of same data source type.
Note: For most of 2D grouped graphs created from plot menu, the grouping info column will be treated as modifier columns, not data columns.
- When duplicating with new columns, each column should have a Plot Designation of Y(for 2D) or Z(for 3D or contour) and should be in the same sheet.
- When duplicating with new sheets, each sheet should have exactly the same column structure.
- When duplicating with new books, each book should have exactly the same sheet and column structure.
Four Cases of Batch Plotting
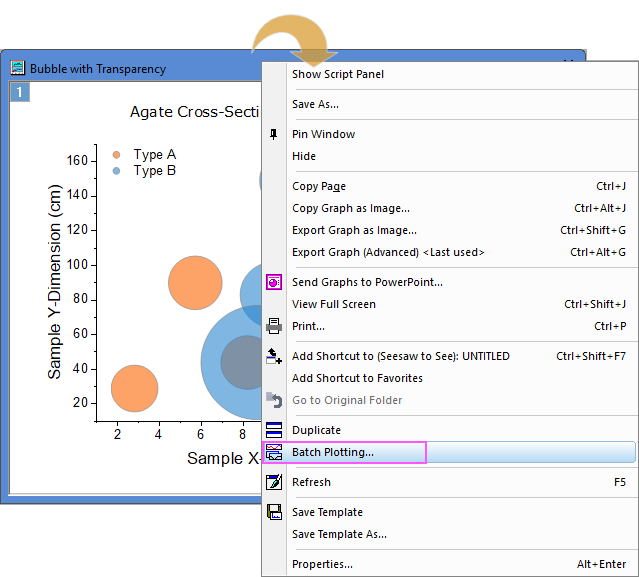
- Right-click on the graph title bar or any blank area around the graph layer frame and select Batch Plotting....
You can use the drop-down list Batch Plot With to switch the different source data to duplicate the current graph:
Once you selected Book/Sheet/Column for the Batch Plot With option, the available books/sheets/columns will be list in the middle blank box respectively.
Duplicate with new books
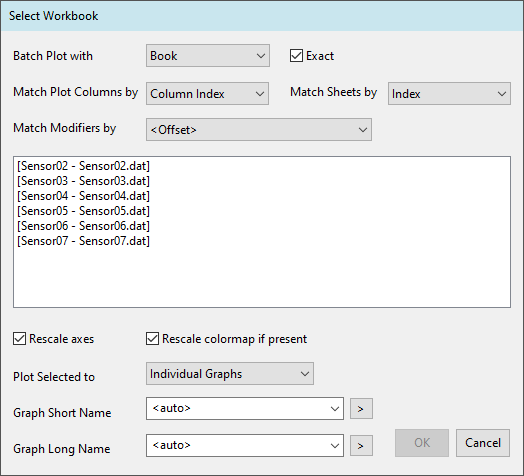
If all plots in a graph are from one book, you can launch the batch plotting feature to duplicate your graph using other books, with the Batch Plot With drop-down list set to Book. As you can see, the Batch Plotting dialog will show Select Workbook at the title bar to indicate current batch mode.
Settings for matching conditions
| Exact
|
When selected (default), list only those books with a sheet and column structure like that of the active graph. If the book contains additional sheets or columns (within a given sheet), they will be ignored when cloning a graph. If the book contains fewer sheets than needed to construct the active graph, the book will not be listed.
When Exact is cleared, books that have the minimum number of sheets but fewer columns than needed to construct the active graph may show, depending upon the Match Plot Columns by setting (see next).
|
Match Plot Columns/
Match Sheets by
|
Choosing Long Name, Short Name or Column Index in Match Plot Columns by filter, and Long Name, Short Name or Index in Match Sheet by filter, you can implement batch plotting to designated workbooks that have the same structure as the original workbooks.
|
| Match Modifiers by
|
This list is used to specify how to match the modifiers (worksheet columns of values used to modify the plot - e.g. plot color) when do batch plotting with the selected workbook(s). The default selection is associated with the Match Modifiers by control in the Miscellaneous tab of Plot Details dialog. Of course, you can do your own setting for current routine.
|
List the matching books
According to first part filter conditions, all matching books in the project are listed in the middle box. You can select one or multiple books' dataset to do batch plotting.
Settings for result graph
| Rescale axes
|
This box is checked by default. Clear the box to prevent rescale axes upon change of input data.
|
| Rescale colormap if present
|
This box is checked by default. Clear the box to prevent rescale colormap upon change of input data.
|
| Plot Selected to
|
This list is used to specify where the selected books will be plotted to. With this option, you can
- plot the selected books to active graph
- plot each selection to an individual graph respectively
- plot the selected books to one new graph.
|
| Graph Short Name
|
This edit boxes is used to define the duplicated graph short names.
- The default <auto> means to set the duplicated graph Short Name as Graphn, where n is Graph window's sequence number.
- Format strings/Labtalk scripts can be entered, and multiple notations and arbitrary fixed strings can be combined as desired. The
 button to the right of the edit box provides some frequently used notations and example syntax. button to the right of the edit box provides some frequently used notations and example syntax.
|
| Graph Long Name
|
This edit boxes is used to define the duplicated graph long names.
- The default <auto> means to set Long Name as a combination of a fixed string "Duplicated with" and the source workbook and sheet name.
- Format strings/Labtalk scripts can be entered, and multiple notations and arbitrary fixed strings can be combined as desired. The button to the right of the edit box provides some frequently used notations and example syntax.
|
Duplicate with new sheets
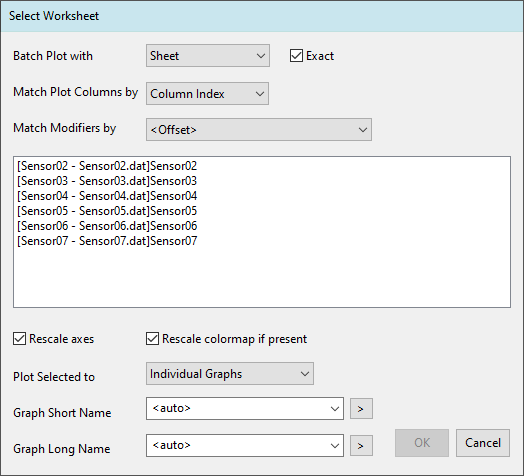
If all plots in a graph are from one sheet, you can launch the batch plotting feature to duplicate your graph using other sheets, with the Batch Plot With drop-down list been set to Sheet. As you can see, the Batch Plotting dialog will show Select Worksheet at the title bar to indicate current batch mode.
Settings for matching conditions
| Exact
|
When selected (default), list only those sheets with a column structure like that of the active graph. If the sheet contains additional columns, they will be ignored when cloning a graph. If the sheet contains fewer columns than needed to construct the active graph, the sheet will not be listed.
When Exact is cleared, sheets that have fewer columns than needed to construct the active graph may show, depending upon the Match Plot Columns by setting (see next). Note that this one way in which you might add new plots to an Active Graph (see Plot Selected to).
|
| Match Plot Columns by
|
Choosing Long Name, Short Name or Column Index in this filter, you can implement batch plotting to designated worksheets that have the same Long Name, Short Name or Column Index structure as the original worksheets.
|
| Match Modifiers by
|
This list is used to specify how to match the modifiers (worksheet columns of values used to modify the plot - e.g. plot color) when you do batch plotting with the selected worksheet(s). The default selection is associated with the Match Modifiers by control in the Miscellaneous tab of Plot Details dialog. Of course, you can do your own setting for current routine.
|
List the matching sheets
According to first part matching conditions, all matching sheets in the project are listed in the middle box. You can select one or multiple sheets' dataset to do batch plotting.
Settings for result graph
The options are the same with the Settings for result graph in Duplicate with new books.
| Note: Change Worksheet is a feature that allows you to recreate an existing 2D graph using datasets in another sheet. Both Batch Plotting with New Sheets and Change Worksheet require sheets with the exact same column structure including short names, plots designations and indexes. Change Worksheet allows you to quickly change data plots within in a layer using a (right-click) shortcut menu command. Change Worksheet can be applied one-by-one to each plot within a multi-plot layer. This feature is available when plots are not "grouped". When plots are "grouped", click once, pause, then click a second time and this feature will become available (note that in this mode, you are still only replacing a single plot -- not the entire plot group).
|
Duplicate with new columns
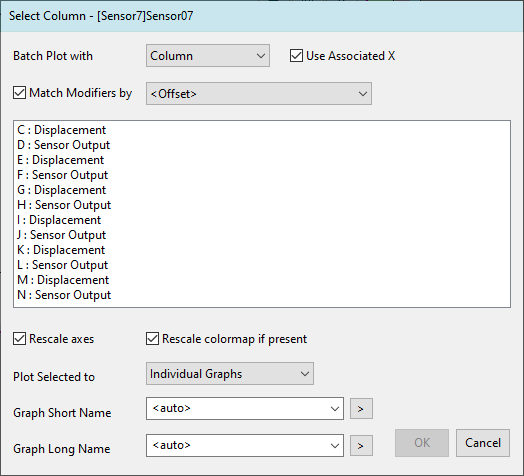
If the plot is from a Y/Z column in the worksheet, you can duplicate your plot using other Y/Z columns in this sheet, with the Batch Plot With drop-down list been set to Column. As you can see, the Batch Plotting dialog will show Select Column at the title bar to indicate current batch mode.
Settings for matching conditions
| Use Associated X / Use Associated X&Y
|
This box is checked by default, and when selected, new plots will use the X column(s) associated with selected Y column(s). When this box is cleared, new plots will use the X / X&Y column(s) of the plot being duplicated.
|
| Match Modofiers by
|
This check box and its drop-down list are used to specify how to match the modifiers(the columns used to control the grouping info, plot color or other plot attributes) when do batch plotting with the selected column(s). Here, the default selection follows the Match Modifiers by control in the Miscellaneous tab of Plot Details dialog.
Please note, for this kind of batch plotting, you are strongly recommended to select <Offset> for this option to pick the modifying column(s) with the same column offset starting from the selected plot column, since selecting any column label will always map the plot attributes to the first eligible columns in current worksheet.
|
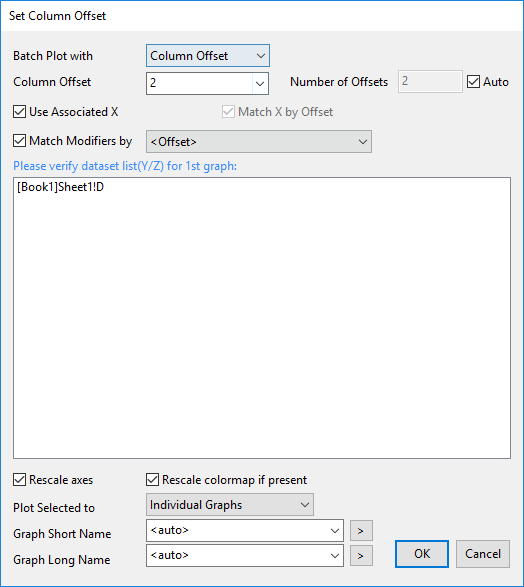
Duplicate with column offset
If the plot is from a Y/Z column in the worksheet, you can duplicate your plot using other Y/Z columns in this sheet, with the Batch Plot With drop-down list been set to Column Offset. As you can see, the Batch Plotting dialog will show Set Column Offset at the title bar to indicate current batch mode.
Settings for matching conditions
| Column Offset
|
Specify an offset from the column(s) used in source graph to batch plot the columns with this offset. For example, if the source graph has a scatter plot with Y column D&E, Column Offset = +2 means new plot columns are column F&G, Column Offset = -2means new plot columns are column B&C.
|
| Number of Offsets
|
Specify how many times to do the batch plotting. By default, Auto is checked to calculate how many times to do the batch plotting at most.
You can uncheck Auto check box and enter a value smaller than the auto-calculated value. For example, if the source graph has a scatter plot with Y column D&E. If Number of Offsets is not set to 1, it means repeat the batch plotting with following columns, Column Offset = +2 and Number of Offsets = 3 for the source graph with Y column B&C means new plot columns are column D&E, F&G, H&I.
The auto calculation for this option will follow the rules below:
- When Match Modifiers by is <Offset>, Number of Offset will consider modifier column to make each copy data contain its modifier column.
- When Use Associate X is uncheck and Match X by Offset is selected, Number of Offset will consider X column to make each data copy contain its X column.
|
| Use Associated X / Use Associated X&Y
|
This box is checked by default, and when selected, new plots will use the X column(s) associated with selected Y column(s). When this box is cleared, new plots will use the X / X&Y column(s) of the plot being duplicated.
|
| Match X by Offset
|
This box is dimmed and unchecked by default. Only available when Use Associated X/X&Y is unchecked. When unchecked, use original graph's X; when checked, use the offset to determine X. As with the Use Associated X option, Match X by Offset will apply to error, label, Y (co-plotted with Z) columns.
|
| Match Modifiers by
|
This check box and its drop-down list are used to specify how to match the modifiers(the columns used to control the grouping info, plot color or other plot attributes) when do batch plotting with the selected column(s). Here, the default selection follows the Match Modifiers by control in the Miscellaneous tab of Plot Details dialog.
Please note, for this kind of batch plotting, if Match Modifiers by is set to Offset, Origin will apply same column offset to modifier columns; if Match Modifiers by is set to others, Origin will use current matching rule to find modifier, in most case they will be same as the source graph.
|
|