4.3.3 Setting Column DesignationWksCol-SetDesignation
Every worksheet column will have a Column Designation (aka a Plot Designation). The Column Designation determines how the data in the column are to be treated during plotting and analysis operations.
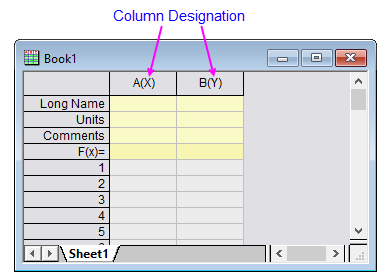
For instance, the default Origin worksheet has one "X" and one "Y" column. When you select data contained in these two columns (one only needs to select the Y column for reasons explained in the next table - see X, Y, Z:) and click a plotting toolbar button (e.g. the Scatter  button), the Column Designation determines which column of data is plotted against the X axis and which is plotted against the Y axis. button), the Column Designation determines which column of data is plotted against the X axis and which is plotted against the Y axis.
- Right-click and choose Properties and choose a Plot Designation.
- Right-click and choose Set As and choose X, Y, Z, etc.
- Use buttons on the Column toolbar.
- Use buttons on the single-column Mini Toolbar.
Alternately, you may have the opportunity to set Column Designation during file import; when creating plots with the Plot Setup dialog box; when selecting your data range in one of the many analysis dialog boxes; or when constructing a worksheet using the New Workbook dialog.
Worksheet Column Designations
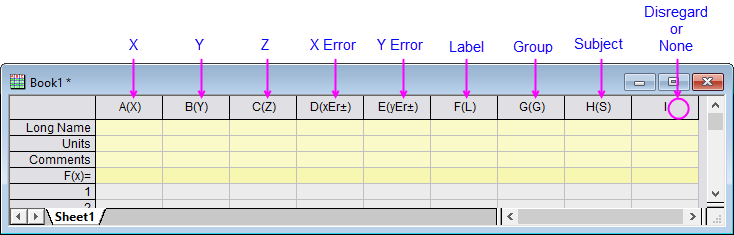
In Origin, there are nine Column Designations that you can apply to your worksheet column data: X, Y, Z, X Error, Y Error, Label, Group or Subject (only used in ANOVA and some statistical tests), and Disregard.
| X, Y, Z:
|
In a worksheet with one designated X column, the X column provides X values for all Y columns (to the left or right) and Z columns (to the right only) in the worksheet.
For a worksheet with more than one designated X column, each X column supplies X values for all Y and Z columns to the right of the X column (but only for those to the left of an additional X column). In the case of nonadjacent column selection, the selected X column provides X values for the selected Y and the selected Z columns. If an X column isn't included in the selection, Origin finds the first X column to the left of the selected Y column or Z column. If none exists, Origin looks to the right of the selected Y column (Origin will not look to the right for an X column associated with a Z column).
Note: In a worksheet with no designated X column, you can create (Column:Set Sampling Interval) and display (Column:Show X Column) regularly-spaced default values.
|
| X Error
|
In a worksheet with one designated X column, values in an X error column set the size of the X error, independent of column locations in the worksheet.
For a worksheet with more than one designated X column, values in an X error column set the size of the X error for the first X column to the left. If none exists, Origin looks to the right of the selected X error column. In the case of nonadjacent column selection, the selected X error column provides the X error values for the selected X column. If more than one X column is selected, Origin looks to the left for a selected X column and if none exists, then to the right. If an X column isn't included in the selection, Origin finds the first X column to the left of the selected X error column. If none exists, Origin looks to the right of the selected X error column.
|
| Y Error
|
Values in the Y error column set the size of the Y error for the first Y column to the left of the Y error column. In the case of nonadjacent column selection, the selected Y error column provides the Y error values for the selected Y column nearest to the left of the Y error column.
|
| Label
|
Text or numeric values in a Label column, are used to label the Y column values immediately to the left. In the case of nonadjacent column selection, the selected label column provides data labels for the selected Y column. If more than one Y column is selected, Origin associates the Label column with the selected column nearest to the left.
| Note: Labeling data points in this way is an old method and it remains primarily for backward compatibility. In earlier versions of Origin, designated Label columns appeared as a separate dataset in Plot Details. Beginning with Origin 2020b, designated Label columns will simply be treated as a display option of the actual data plot and will be controlled via a common Label tab. For a more complete explanation of data labeling options of 2D graphs, see Labeling Data Points.
|
|
| Group
|
Designates the selected column(s) as a Grouping or Factor column for calculating statistics on columns, for ANOVA tools, etc.
|
| Subject
|
Designates the selected column(s) as a Subject column for repeated measures ANOVA.
|
| Disregard
|
Disregarded columns are not plotted, even if selected in the worksheet. Same as None.
|
Column Designation Symbols
Once you applied a designation to the selected column, a designation symbol enclosed in parentheses will be added in the column heading after the column Short Name. (Note that Disregard (None) columns only show a column Short Name.)
As mentioned, you may have the opportunity to set designations in file import dialogs (e.g. Import Wizard) or when constructing a new worksheet with the New Workbook dialog. Typically, the list controls in these dialogs use the same designations that display in the worksheet column headings, with the exception of the two error designations and the disregarded column designation:
| Designation
|
Column Heading Symbol
|
List Control Symbol
|
| X column
|
X
|
X
|
| Y column
|
Y
|
Y
|
| Z column
|
Z
|
Z
|
| X Error
|
xEr±
|
M
|
| Y Error
|
yEr±
|
E
|
| Label
|
L
|
L
|
| Group
|
G
|
G
|
| Subject
|
S
|
S
|
| None (Disregard)
|
|
N
|
Repeating Designation Patterns
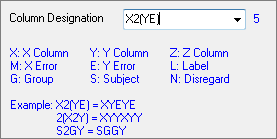
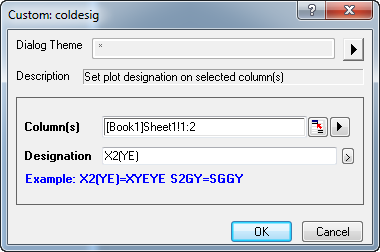
Using the above designation symbols, you can write or select a user-defined or existing designation pattern to specify designations for multiple columns at a time as, for instance, in the coldesig dialog box or the Construct Worksheet tab of the New Workbook dialog box.
The designation pattern enclosed in parentheses will be repeated to the last worksheet column. If a number N precedes the pattern in parentheses or N precedes a single plot designation symbol, the pattern or the single plot designation will be applied N times. For example, if you choose (XY), the plot designations of the columns will be set to the repeating pattern of "XYXYXY...". If you specify 3(XY), the plot designation will be set to "XYXYXY". In this particular case, if the number of worksheet columns is more than 6, any remaining columns will be designated as Y (e.g. "XYXYXYYYYY...").
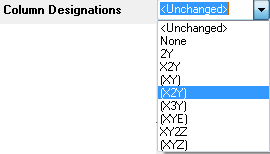
Set Designation During Data Importing
When you import data, some import dialogs(including Import Wizard) provide the option Column Designations to set plot designation for the imported data. You are allowed to select a pre-assembled pattern from the drop-down list or just type the designation symbols directly.
When you use New Worksheet dialog (Opened by selecting File: New: Worksheet menu) to create a new worksheet before importing data, you are allowed to preset the column designation for the new worksheet using the similar Column Designation combo box.
Set Designation from Worksheet
Once the data had been imported into worksheet and arranged as multiple columns, you have multiple ways to set their plot designation.
"Set As" Menu
When a single column has been highlighted, you can right-click on it to set its plot designation from the Set as context menu.
When multiple columns have been highlighted, you can right-click on them to select a single plot designation or a designation pattern(such as "XY") from the Set as context menu, then the single plot designation or the pattern will be applied several times until reach the ending column. For instance, selecting the pattern "XY" will set the plot designations of the target columns to "XYXYXY...". Furthermore, selecting Save as: Custom context menu will bring up the Customize Column Designation dialog.
Customize Column Designation dialog
This dialog is used to specify user-defined designation pattern to selected column(s).
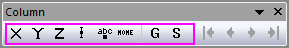
Column Toolbar
With the target column(s) selected, you can use the buttons in the Column toolbar to set the column plotting designation.
Column Properties dialog
Highlight one column and then right-click on it to select Properties... from context menu to open the the Properties tab of Column Properties dialog, you are allowed to set its plot designation from the Plot Designation drop-down list.
Specify Designation during Plotting and Analysis
By default, after selected source data to do plotting or analysis, the pre-set plot designations on worksheet columns will be used. Besides, you are also allowed to use interactive data selection controls to specify the designations for current routine and ignore the existing designation settings.
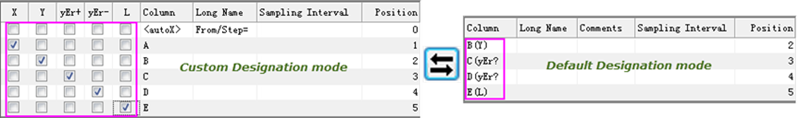
Column Designation in Plot Setup Dialog
In Plot Setup dialog, after selected source data and chose desired plot type, you can designate column in the middle panel. Here, two display modes are available: Default Designation mode and Custom Designation mode.
When you triggered the default designation mode, the plot designations from the worksheet columns will be used; When you switched to the custom designation mode, you can use the check boxes before the Column column to set the plotting designation (such as X, Y, Z, Label, X Error, Y Error, etc) for each column.
For more details, please refer to the instructions in this help page.
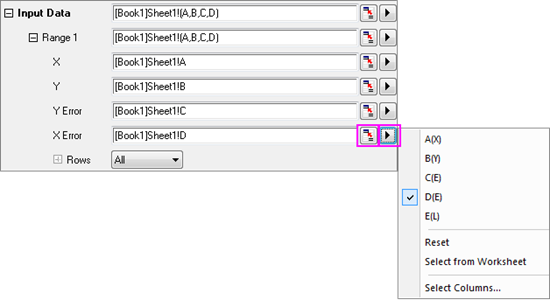
Input Data selection in many Analysis Dialogs
In most analysis dialog, whether you have set column designations in the source worksheet or not, you are allowed to use the Interactive Range Selector button  or right-pointing triangle button or right-pointing triangle button  to select desired columns from the source worksheet/graph or context menu for the current input data element. to select desired columns from the source worksheet/graph or context menu for the current input data element.
More details about selecting input data, see Specifying Your Input Data.
|