10.1.3 Data Highlighter: Selecting Points in both Graph and Source WorksheetData-Highlighter
Use the Data Highlighter tool  (Tools toolbar) to select plotted data points in your 2D graph or 3D Scatter/Bar graph(from worksheet data) and simultaneously highlight the corresponding data rows in the source sheet; or you can select rows of data in the worksheet and highlight corresponding points in plots of that data. (Tools toolbar) to select plotted data points in your 2D graph or 3D Scatter/Bar graph(from worksheet data) and simultaneously highlight the corresponding data rows in the source sheet; or you can select rows of data in the worksheet and highlight corresponding points in plots of that data.
How to Highlight Points with Data Highlighter
Highlighting Points in the Graph
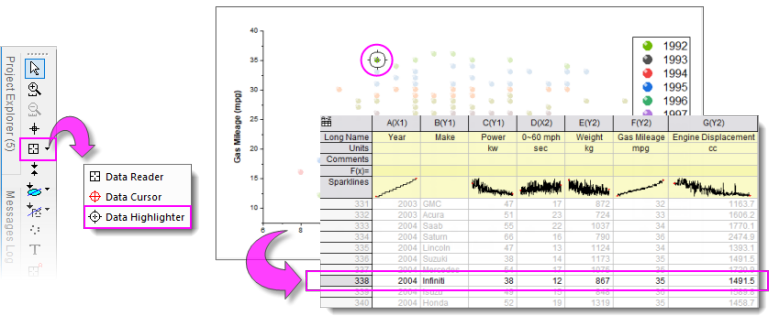
- Activate the graph window, then pick the Data Highlighter tool from the Tools toolbar.
- Click on a point in your graph window. Unselected data points in the graph window will be dimmed. The corresponding row of worksheet data will be highlighted while corresponding rows of unselected data points will be dimmed.
- While in selection mode on the graph, you can use the left and right arrow keys to move the selection to the previous or next point, by row index.
- To select multiple random points in the graph, press CTRL + while clicking with the mouse.
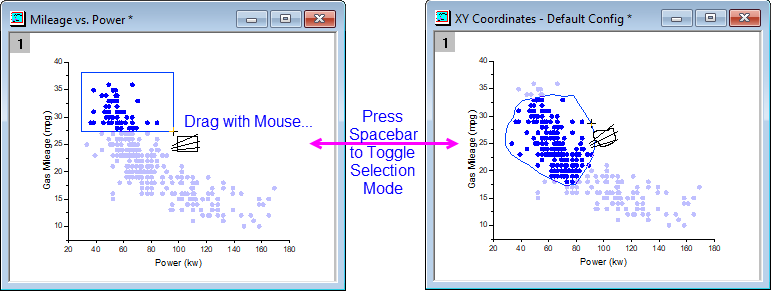
- To select group of points in the graph, drag out an area with the mouse. While the Data Highlighter tool is active, use the spacebar to toggle between rectangular and free-form selection modes.
Highlighting Points in the Worksheet
- Activate the workbook window, then pick the Data Highlighter tool from the Tools toolbar.
- Click on a row in the worksheet to highlight all data plots of row data (can be multiple graph windows). Unselected data points in the graph window(s) and worksheet will be dimmed.
- While in selection mode in the worksheet, press the left and right arrow keys to move the selection to the previous or next row; simultaneously, you will move the selection to the corresponding data point in the graph window(s).
- To select multiple random rows in the worksheet, press CTRL while clicking on desired rows with the mouse; to select multiple contiguous rows, press SHIFT while clicking on the first and last desired rows or drag rows with your mouse.
Further Operations for the Highlighted Points
Once you highlighted any data point or worksheet row, the Data Highlighter Mini Toolbar will pop up on the right-top of the Graph window or Workbook window.

Using this toolbar, you can copy data points, delete points and mask or unmask points easily.
Copying Points
Click Create Subset Sheet button  to copy the highlighted rows/points to a separate new sheet. to copy the highlighted rows/points to a separate new sheet.
Creating Categories
Click Create Categories button  to open the Create Categorical Value dialog. to open the Create Categorical Value dialog.
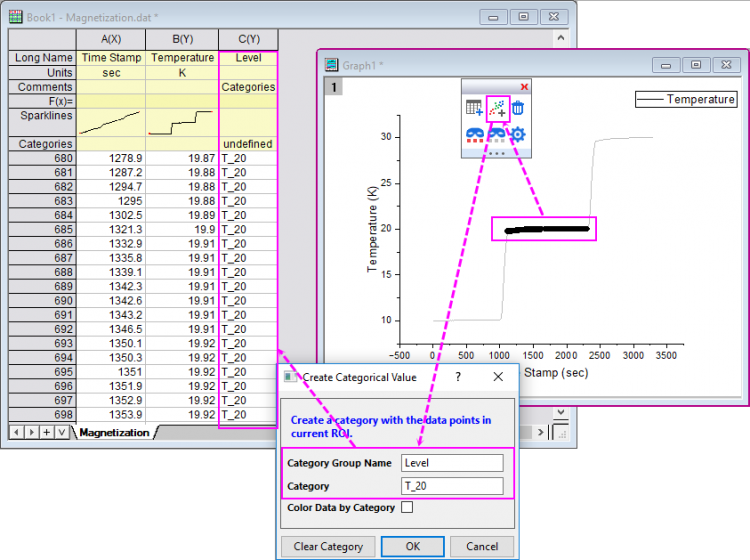
This dialog is similar with that of Cluster gadget, can be used to create a category for the highlighted rows/points. You are allowed to repeatedly create categories, by reopening the dialog or directly pressing hotkey "C" without opening the dialog.
Deleting Points
Click Delete Points button  delete the highlighted data points or worksheet rows. delete the highlighted data points or worksheet rows.
Masking/Unmasking Points
Click Mask/Unmask Highlighted Points button  to mask or unmask the highlighted points/rows. And, you can use the Mask/Unmask Dimmed Points button to mask or unmask the highlighted points/rows. And, you can use the Mask/Unmask Dimmed Points button  to mask the other un-highlighted dimmed points. to mask the other un-highlighted dimmed points.
Customizing the Behaviors of Copying Points
Click the Open Properties Dialog button  to open the Highlighter Properties dialog. to open the Highlighter Properties dialog.
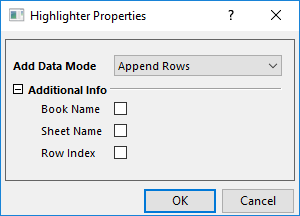
Add Data Mode: Decide how to copy the highlighted points.
- Append Rows: Append the points to the existing result sheet directly when copying the points.
- Append Rows With Gap: Append the points with one-row start gap when copying the points, within each data highlighting process.
- Start New Sheet: Create a new sheet to append the points. This is the default selection for each data highlighting process.
- Start New Columns: Add new columns to the existing result sheet to append the points.
Additional Info: Decide whether include the data info during the copying the highlighted points.
Further Operations in a version before Origin 2022
For the easier version before Origin 2022, which doesn't have the Data Highlighter Mini Toolbar, you can follow the instructions below to do further operation:
The highlighted worksheet data rows remains selected even after exiting Data Highlighter mode (press ESC or click on the Pointer tool  ). This allows you to further operate on the data. The following actions are supported: ). This allows you to further operate on the data. The following actions are supported:
- Clearing Cells: Right-click on the worksheet selection and choose Clear from the shortcut menu; or press the DELETE key. Leaves worksheet cells.
- Deleting Rows: Right-click on the worksheet selection and choose Delete Rows. Removes worksheet cells.
- Masking Data: Click Column: Mask or click the Mask button
 on the Mask toolbar. Other masking-related operations are also supported. on the Mask toolbar. Other masking-related operations are also supported.
- Copying Data: To copy only data in the data rows of the worksheet, press CTRL + C or right-click on the selection and choose Copy. To copy the worksheet column label row information along with the data row selection, open the Script Window (Window: Script Window) and type the following:
wcopy -d
- In the wcopy dialog that opens, make sure that the Copy Data check box is selected, then specify the Output Worksheet and click OK.
|