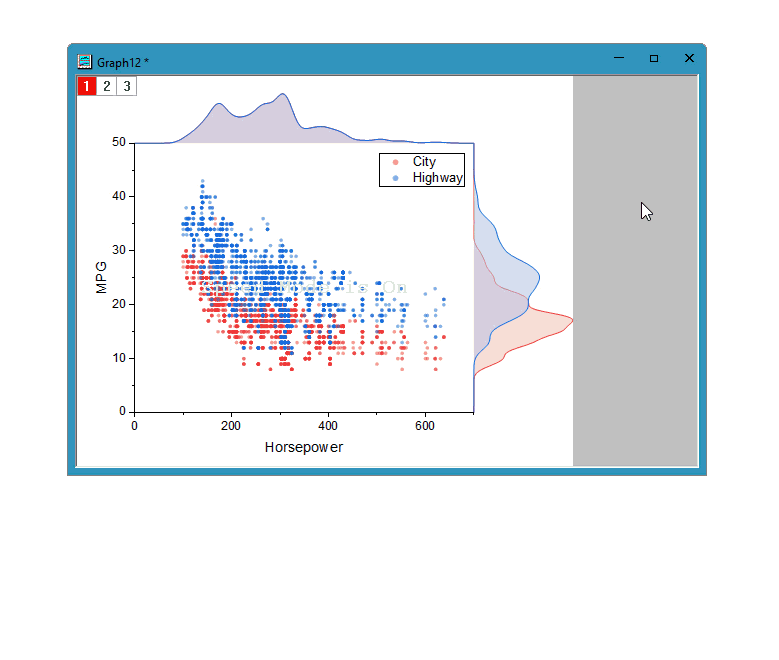
10.3 Graph Data SlicerGraph-Data-Slicer
Besides applying filter to worksheet (i.e. worksheet data slicer), you can apply filters on graph directly (i.e. graph data slicer).
Worksheet Data Slicer vs. Graph Data Slicer
- is a Worksheet-based filter.
- If the source worksheet has any filter, turning on data filter on any graph plotted from this worksheet will apply the existed worksheet filter. This is called worksheet data slicer.
- Worksheet data slicer applies to worksheet and will also to all graphs plotted from this worksheet. Changing filters (condition or enable/disable status) in the graph will update worksheet and all graphs created from this worksheet. Vice versa.
- If the source worksheet has no filter, turning on data slicer on any graph plotted from this worksheet will pop up dialog allowing you to choose a column to apply filter to. This type of filter is called graph data slicer.
- Graph data slicer only applies to current graph and NOT touches data in the source worksheet. That is to say, the filter on current graph will not affect other graphs even though they are all plotted from the same worksheet. If you delete the graph window on which the data slicer is based, all analysis and performance derived from this slicer will also be removed.
We always recommand graph data slicer not only because it only affects the current graph (in this sense independent of source worksheet), but also because it has more useful features such as duplicate plot(s) for comparesion, and will keep improving in the feature.
Add Data Slicer to Graph
- Active a graph whose source worksheet has no data filter applied.
- Select menu Data: Slicer.
Or,
Click Add/Remove Data Filter button  on the Worksheet Data toolbar. on the Worksheet Data toolbar.
Or,
Hover the cursor over the edge of the graph page until the cursor changes to  . Single clicking on the blank area will bring up the page-level mini toolbar. Click Data Slicer button. . Single clicking on the blank area will bring up the page-level mini toolbar. Click Data Slicer button.
- A Add Slicer to Graph dialog opens.
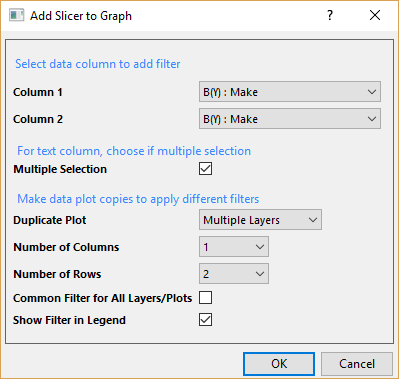
- Select up to two columns to apply slicers to. Note that you can always add more slicers later.
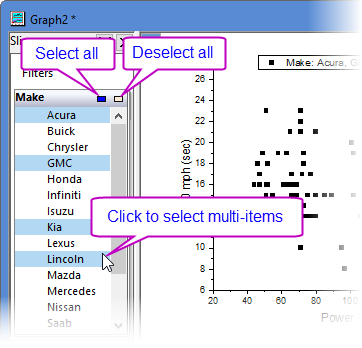
- If the selected filter column is Text format, you can check Multiple Selection to enable selecting multiple items for the filter condition. You can also switch between Single Selection and Multple Selection after the slicer is added. See next section.
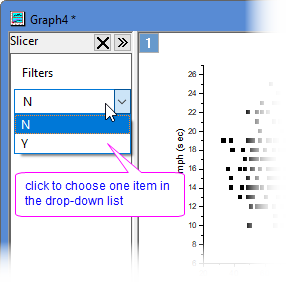
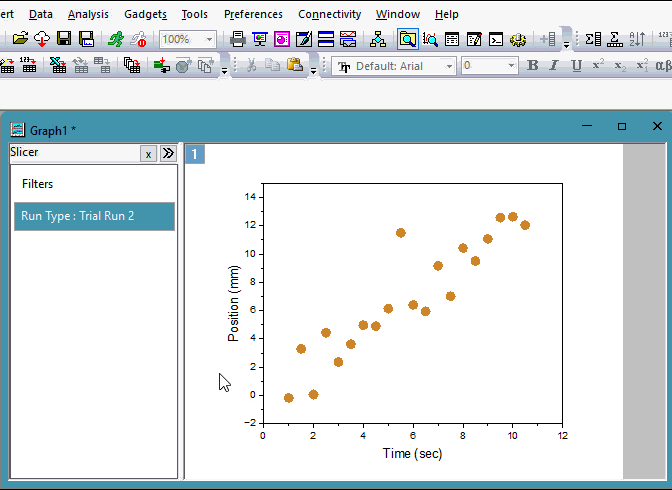
Slicer applied on a text/categorical column can have 2 selection modes:
Single Selection vs. Multple Selection
| Single Selection
|
Multiple Selection
|
| A drop-down list to choose only one item at a time.
|
A drop-down list to select multiple items.
The graph is auto-updated once you select/deselect an item.
Click outside the list to finish selection.
|
|
|
- To intuitively comparing different filter conditions, you can choose Duplicate plot.
| Duplicate Plot
|
- Do not duplicate plot.
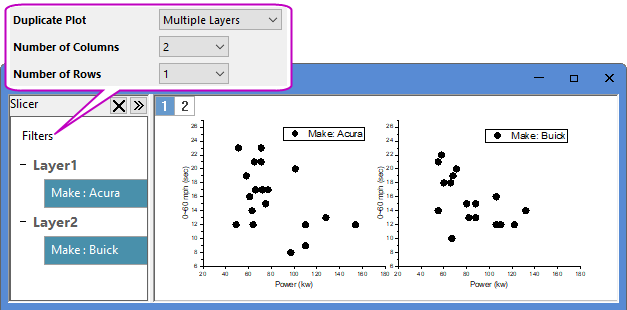
- Duplicate plots in the same layer. For multi-layer graph, only this option is available for duplication.
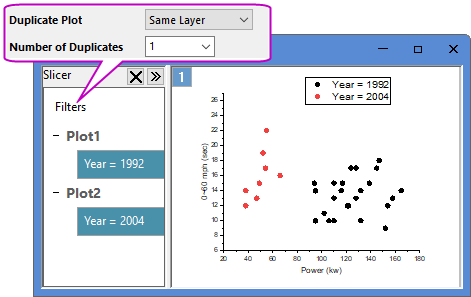
- Duplicate plots to multiple layers. This option is available for single layer graph only.
|
| Number of Duplicates
|
When Dulicate Plot = Same Layer, use this edit box to specify the number of duplicated plots.
|
Number of Columns/
Number of Rows
|
When Duplicate Plot = Multiple Layers, use these two drop-down lists to determine the number of duplicates and the panel layout.
The number of duplicates = Number of Columns X Number of Rows - 1.
|
| Common Filter for All Layers/Plots
|
- For multiple-layers graph, ALL filters you defined in Add Slicer to Graph dialog will apply to ALL layers. Check this checkbxo to set a common filter control for all layers and thus all layers will be applied by same filter condition.
- Otherwise, each layer will have its own filter control. In this case, filters on different layers are independent from each others. That is to say, you can set different filter conditions for different layers, remove an existed filter or add new filters to one layer but not touch other layers.
You can also right click on any slicer and choose Move to Filter as Common Filter to transfer all filters into one common control.
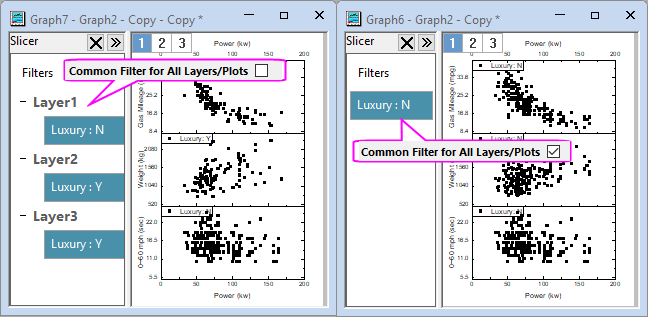
- You can even have mixed controls in one graph, by adding new filter To All Plots or Common Filter to Page.
|
| Show Filter in Legend
|
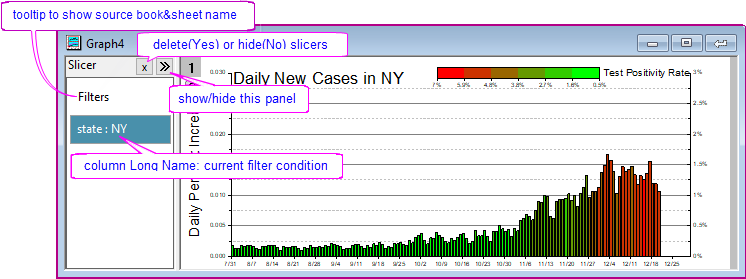
Check this checkbox to show current filter condition in the legend. The legend will auto-update when the filter is changed.
Note that you can also add filter info to layer title by Add Layer Filter button  from page-level mini toolbar. from page-level mini toolbar.
|
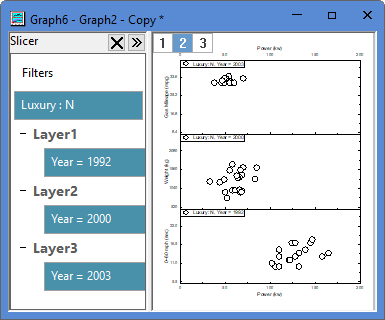
- The Data Slicer panel will be turned on at the left side of the graph window, listing the filter you just set. Graph will update accordingly. You can view and change the current filter condition, add more filters, remove existed filters, or reorder them, see next section for details.
 | If the source worksheet (from which the graph is created) has one or more filters, no matter the filter is enable or not, turning on Data Slicer panel (by Data Filter button ton ) will transfer all the worksheete filters to the graph window.
In this case, you CANNOT add a new slicer. You can only view and edit the existed filters. See next section for available editions.
|
Filter Controls
- Right clicking on the blank area inside Slicer panel will bring up context menus to copy/paste filter, add filters, and duplicate layer with filters.
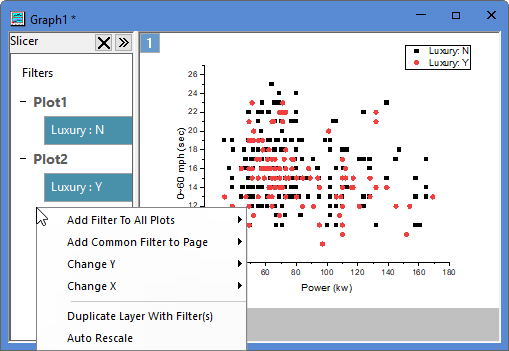
| Add Filter To All Plots
|
Select a column from sub-menu list to add a new filter to layer level, which will apply to all plots in all layer but have independent filter control in each layer level. In this case, you can set different filter conditions to diffferent layer filters for comparison.
|
| Add Common Filter to Page
|
Select a column from sub-menu list to add a new filter to page level, which will apply to all plots in all layers and have a common control in page level.
|
Change X/
Change Y
|
Change X/Y if all layers share the same X/Y column, and rescale to show all.
|
| Duplicate Layers With Filter(s)
|
Duplicate layers with filter(s) to the current graph for comparison.
|
| Auto Rescale
|
Check this item to auto rescale axes according to the filter results.
|
- Right clicking on any data slicer will bring up a context list to disable/delete, reorder, edit filters.
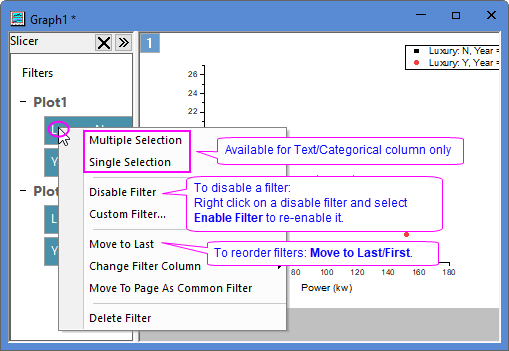
Multiple Selection/
Single Selection
|
Filter on a Text/Categorical column can have Multiple Selection' and Single Selection. Choose the menu item to switch between the two selection modes.
|
Custom Filter/
Change Condition Type
|
Different options are provided according to the format of the column to which the filter is applied.
- Text & Categorical
- Right click on a text/categorical slicer and select Custom Filter... context menu to open the Custom Filter (Advanced Text) dialog for advanced editting. Refer to this page for how to set a text filter.
- Numeric
- For simple editting, left-click on a Numeric slicer to open the Simple Numeric Filter dailog, or right click on the slicer to select Change Condition Type context menu and select a condition from the pop-up list.
- Right-click and select Custom Filter... context menu to open the Custom Data Filter dialog for advanced editting. Refer to this page for how to set a numeric filter.
- Select Change Condition Type: Load to load a saved filter condition.
- Data & Time
- For simple editting, left-click on a date and time slicer to open the Simple Date Filter dailog, or right click on the slicer to select Change Condition Type context menu and select a condition from the pop-up list.
- Right click and select Custom Filter... context menu to open the Custom Data Filter dialog for advanced editting. Refer to this page for how to set a date filter.
- Select Change Condition Type: Load to load a saved filter condition.
|
| Change Filter Column
|
Choose a column from the pop-up list to switch the current filter to.
|
| Move To Page As Common Filter
|
For a data slicer based on current layer, choose this item to move it to page level so that the filter condition is applied to ALL layers (all plots) and share the same filter control.
|
| Delete Filter
|
Delete selected data slicer.
- You can also click Add/Remove Data Filter button on the Worksheet Data toolbar to remove ALL data slicers on the current graph window.
- Note that all analysis derived from slicers will also be removed.
|
Explore Graph with Data Filter
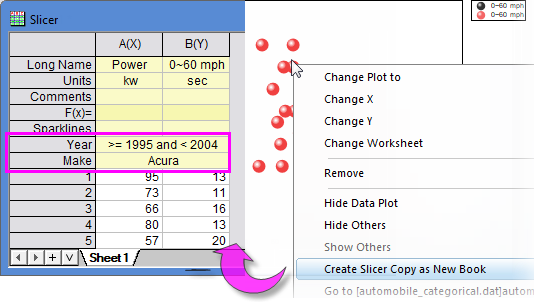
Extract Filtered Data
Right click on the filtered plot and select Create Slicer Copy as New Book.
A workbook named Slicer will be created containing the filtered data. Filter condition shows in the User-defined parameter.
Analysis on Graph with Graph Data Slicer
Things you need to know...
- If you want your analysis results recalcute upon any filter condition changes, you will need to add the data slicer BEFORE performing the analysis operation. For example, if you open the fitted curve graph from the Linear Fit report sheet
and add a data slicer, the linear fitting results will NOT update if you change the filter condition.
- Any analysis performed on a graph with data slicer(s) is based on the filtered data and independent of the source data. The analysis results will be output to a hidden workbook, which can be activated by clicking on the analysis' green lock and choosing Go to Results. On the other hand, clicking on the green lock in the report sheet, or clickin on the link in Notes table > Data Filter cell can go to the source graph.
- Always keep in mind that deleting the graph window will delete all operation outputs based on graph data filter.
- If you perform some analysis on a graph with data slicer, duplicating the graph will pop up a dialog asking whether to include the analysis operations and outputs.
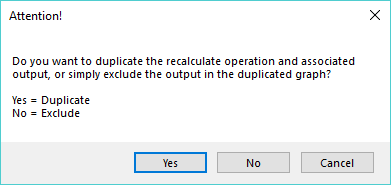
- Click Yes to duplicate both the graph and the analysis (operations and associated outputs). In this case, changing filter condition or analysis parameters will update the current graph window only, not affect the other window.
- Click No to duplicate the graph only, no analysis.
|