11.4 The Cluster Gadget (Pro Only)Gadget-Cluster
Overview
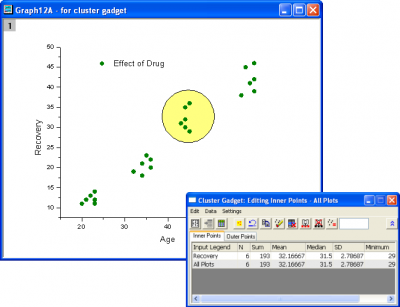
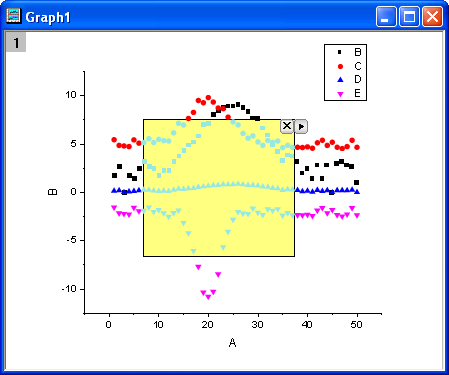
The Cluster Gadget performs simple statistics on a ROI (Region of Interest) in a graph. The gadget can also be used to edit, clear, or mask data points. The statistics results are dynamically updated as the ROI object is moved or resized. There are two panels in this gadget dialog. The upper panel provides tools to manipulate the ROI data points, while the lower panel shows basic statistical information with ROI.
With the Cluster gadget, you can:
- Quickly perform basic statistics on a cluster of data.
- Easily edit the data points using menu options or buttons.
- Switch between rectangular or elliptical ROI.
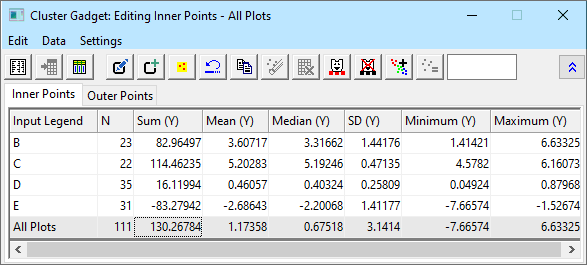
- View statistics of points inside and outside of the ROI.
- Output results for inner and outer points to worksheet.
Notes:
- The statistics results in the lower panel will display once you move or resize the ROI.
- Right-click inside the results panel to view context menu to turn on/off data plots to be included in the computation.
- Operations such as masking and clearing are controlled by buttons in the dialog. The Data menu can be used to determine which data plots will be affected by these buttons.
|
To Use Cluster Gadget
To use the Cluster gadget, select Gadgets: Cluster from the main menu when a graph is active.
 | Most of Origin's analysis tools do not allow modifying imported data. However, some functions of the Cluster Gadget allow data modification (e.g. the Set Value button and accompanying edit box). Thus, if you are importing data using a Data Connector, and you intend to use functions which modify imported data, you should unlock data in the import workbook.
|
The Gadget Dialog's Toolbar Buttons
These buttons are used to manipulate data points within ROI range. You can select from Data menu to change working plots. You can also use options in Edit menu to work on data points.
| Output Statistics Report

|
Click to output statistics report. The content of the report can be set in Cluster Manipulation Preferences.
|
| Go to Report Worksheet

|
Click to go to the results worksheet. It is only available after the report worksheet has been created.
|
| Go to Source Worksheet

|
Click to go to the worksheet for the selected data points. If plots come from different worksheets, it will go to the worksheet of the first selected plot.
|
| Modify ROI

|
Click to open the Create ROI dialog box. Select a shape and drag it out on your graph. The dialog will stay open until you click Done (allowing you to start over with another ROI shape, if needed).
|
| Add New ROI

|
Click to add additional ROI(s) to the graph. When you have added a new ROI, click Done . If you wish to add another ROI, click the Add New ROI button again and repeat the process. Each added ROI will be assigned a different color and shown in the ROI column of the Cluster Gadget. Switch ROIs by clicking on the ROI in the graph.
- ROIs within the graph window will share Preferences except Fill Color, Shape and Shape Position.
- ROI Fill Color will show as the first column of the tool to identify the active ROI.
- When multiple ROIs exist and Color Inner Points is checked, only points in active ROI will be colored.
|
| Switch Inner/Outer Points

|
Click to determine whether points inside or outside ROI will be edited by operations such as masking and clearing data. The dialog title will indicate the status of this button.
|
| Undo Last Change

|
Click to undo the last action.
|
| Copy Data

|
Click to copy the values of the selected data points.
|
| Clear Data

|
Click to clear the cells of the selected data points in the source worksheet.
|
| Delete Worksheet Rows

|
Click to delete rows corresponding to cells of the selected data points in the source worksheet.
|
| Mask Data Points

|
Click this button to mask the cells of the selected data points in the source worksheet.
|
| Unmask Data Points

|
Click to unmask the cells of the selected data points in the source worksheet.
|
| Create Categories

|
Create a category group, add data within current ROI into that group and set categorical values. The Create Categorical Value dialog will open by clicking this button, allowing you to set category. Category group column(s) will be added to the source worksheet.
Note that once you have defined a Category, you can move the ROI around the graph with your mouse, pressing hotkey "C" to add additional points to the same category (without opening the Create Categorical Value dialog again).
|
| Set Value

|
Click this button to set the value of the selected data points in the source worksheet to the value entered in the edit box to the right of this button.
|
| Show/Hide Bottom Panel

|
Click this button to show/hide the dialog's bottom panel.
|
Notes:
- These edit buttons (such as Clear Data, Delete Worksheet Rows, Mask Data Points, Unmask Data Points, Set Value) will be disabled when locked analysis plots are selected.
- A data point can belong to only one category (group). If a data point is set to one group and then set to another, it will be overridden by the later assignment.
|
Create ROI
Use this small dialog to add ROIs of a given shape to the current graph window. If you wish to add multiple ROIs, you will need to click Done when you've added the current ROI and initiate drawing a new ROI by clicking the Add New ROI button on the Cluster Gadget's toolbar.
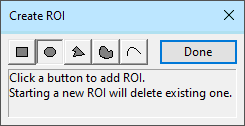
For assistance with creating shapes, see Drawing a Smooth Curve and Drawing 2D Objects.
Create Categorical Value
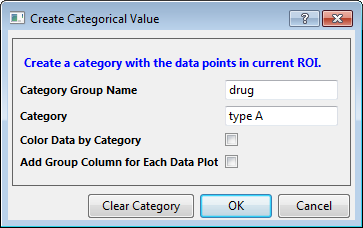
Create a category with the data points in current ROI and set its value.
| Category Group Name
|
Enter a name for the category group. This group name will be the Long Name of the Categories column.
|
| Category
|
Enter a category value for the group. It can be numeric data or text string. For a group, you can add multiple categories.
|
| Color Data by Category
|
Specify whether to set the new categorical column value as the data plot color index.
|
| Add Group Column for Each Data Plot
|
Specify whether to add category group column for the selected plot(s) (by Data menu) only or add group columns for all plots in the layer, one for each plot respectively. It is unchecked by default.
|
| Clear Category
|
To clear the data points from the category in current ROI, and the data points category information will be set to undefined.
|
 | Once you have defined a Category, you can move the ROI around the graph with your mouse, pressing hotkey "C" to add additional points to the same category.
|
The Gadget Dialog's Menu Settings
Edit
Use these menu options to edit selected data points in the source worksheet.
| Undo
|
Undo the last action.
|
| Copy Data
|
Copy the values of the selected data points.
|
| Clear Data
|
Clear the cells of the selected data points in the source worksheet.
|
| Delete Worksheet Rows
|
Delete rows corresponding to cells of the selected data points in the source worksheet.
|
| Mask Data Points
|
Mask the cells of the selected data points in the source worksheet.
|
| Unmask Data Points
|
Unmask the cells of the selected data points in the source worksheet.
|
| Create Categories
|
Create a category group, add data within current ROI into that group and set categorical values. The Create Categorical Value dialog will open by selecting this menu, allowing you to set category. Category group column(s) will be added next to data plot(s) in the source worksheet.
|
| Notes: These menu options (such as Clear Data, Delete Worksheet Rows, Mask Data Points, Unmask Data Points) will be disabled when locked analysis plots are selected.
|
Data
This menu specifies which data plots will be affected by buttons such as for clearing and masking data.
Note: Data plots and stats displayed in lower panel are not affected by this menu. To control lower panel entries, right click inside panel and use the context menu.
| Plot(n)
|
Select the nth plot in the active layer.
This menu will show first 20 datasets/plots. If there are more than 20 plots in the graph, you can click More... at the bottom of the plots list to open the Select Plot(s) dialog to select other plots.
|
| Show Locked Analysis Plot(s)
|
Determine whether to show locked analysis plot(s) in Data menu. Locked plots are usually generated from other analysis tools, like fitting, smoothing, etc.
|
| All Plots
|
Select all plots listed in Data menu. Note that if locked analysis plots are not shown in Data menu, they will not be selected.
|
| Inner Points
|
Check to work on data points inside ROI.
|
| Outer Points
|
Check to work on data points outside ROI.
|
Settings
| Use Circular ROI Box
|
Toggle the shape of the current ROI between rectangle or circular (only available for these ROI shapes).
|
| Expand to Full Plot(s) Range
|
Expand the ROI's width and height to fit all selected plots.
|
| Expand to Full Layer Width
|
Expand the ROI's width to the selected layer's width.
|
| Expand to Full Layer Height
|
Expand the ROI's height to the selected layer's height.
|
| Reset ROI Position
|
Reset ROI's position to default.
|
| Show Attached Buttons
|
Show Close button and Context menu at the top right of the ROI.
|
| Real-time Calculation
|
Real-time calculation when moving ROI. We suggest to uncheck this option when working on large datasets.
|
| Save as <default>
|
Save the current dialog's setting as the default theme.
|
| Save Theme
|
Save the current dialog's setting as a theme.
|
| Load Theme
|
Load a theme from its theme list.
|
| Preferences
|
Bring up the Cluster Manipulation Preferences dialog for customizing the gadget.
|
The Preferences Dialog Settings
This dialog can be opened by
- Selecting Gadgets: Cluster from the Origin menu.
- Selecting Settings: Preferences from Cluster Gadget dialog's menu.
- Selecting Preferences from the ROI's fly-out menu.
Multiple ROIs within the same graph window will share Preferences except ROI Box tab settings Fill Color, Shape and Shape Position.
ROI Box
| Show Close Button and Context Menu
|
Specify whether to show Close button and Context menu at the top right of the ROI.
|
| Show Tool Name
|
Specify whether to show the tool's name at the top of the ROI.
|
| Fill Color
|
When Point Indicate Mode = None or Color Inner Points, specify fill color of ROI.
|
| Border Color
|
When Point Indicate Mode = Fade-out Outer, specify border color of ROI. In this mode, the ROI displays no fill color.
|
| Point Indicate Mode
|
Specify how to handle indicating point selection with respect to the ROI: Color Inner Points, Fade-out Outer or None.
|
| Shape
|
Specify the shape of the ROI. It can be either Rectangle, Circular or Arbitrary Shape. See the details about these shapes here.
|
| Shape Position
|
This group of settings allows you to set the precise position of the ROI. If Circular is selected in the Shape drop-down list, the settings below actually define a rectangle whose sides lie tangent to the circular ROI.
- X1: Specify the left X position of the rectangle.
- X2: Specify the right X position of the rectangle.
- Y1: Specify the bottom Y position of the rectangle.
- Y2: Specify the top Y position of the rectangle.
|
Output To
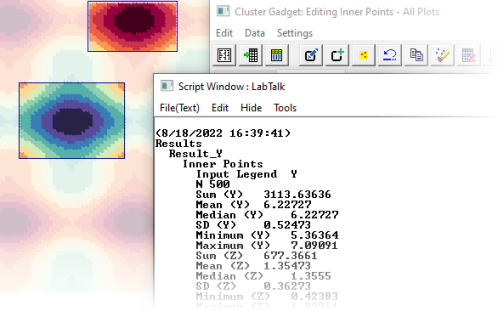
| Script Window
|
Specify whether to output the results to the Script Window.
|
| Result Log
|
Specify whether to output the results to the Results Log.
|
| Append to Worksheet
|
Specify whether to append the results to a worksheet.
|
| Result Worksheet Name
|
If you check the Append to Worksheet box, use this edit box to specify the name of the output worksheet:
- When you generate new output, results are output to [%H-Cluster]RegionStats by default (here %H means the Short Name of source graph), but other books and sheets can be specified. If the book and sheet do not exist, they will be created on output.
- Alternately, you can click the flyout button
 to the right of Result Worksheet Name and choose Sheet in Input Book. This fills the edit box with [<input>]RegionStats. When you generate new output, results are output to a sheet named RegionStats in the source book. to the right of Result Worksheet Name and choose Sheet in Input Book. This fills the edit box with [<input>]RegionStats. When you generate new output, results are output to a sheet named RegionStats in the source book.
|
Calculation
| Calculate Outer Points
|
Specify whether to compute statistics for points out of the ROI.
|
| Real-time Calculation
|
Specify whether to show the real-time result in the Cluster Gadget dialog when moving the ROI. When this check box is cleared, A message "Real-time Calculation is off" will be shown on the top of ROI.
|
| Input Legend
|
Specify whether to output the legend text for the source dataset.
|
| Shape
|
Specify whether to output the shape of the ROI.
|
| Data Points Info
|
This group is used to specify data points info for output.
- Indices
- Specify whether to output the data points' indices.
- Values
- Specify whether to output the data points' values.
|
| Statistics on
|
This group is used to specify whether to compute the statistical quantities for X, Y and Colormap values, within the ROI.
- X Value
- Specify whether to compute statistical quantities for X coordinate values.
- Y Value
- Specify whether to compute statistical quantities for Y coordinate values.
- Color
- When scatter points are colormapped to a column of values, compute statistics on the "color" column.
|
| Quantities to Compute
|
This group is used to specify statistical quantities to compute, within the ROI.
- N
- Specify whether to output the number of data points.
- Sum
- Specify whether to output the sum of the data points.
- Mean
- Specify whether to output the mean of the data points.
- Median
- Specify whether to output the median of the data points.
- SD
- Specify whether to output the standard deviation of the data points.
- Minimum
- Specify whether to output the minimum value (specified by Statistics on) of the data points.
- X/Y at Minimum
- Specify whether to output the X coordinate (if Statistics on = Y Value)/ Y coordinate (if Statistics on = X Value) of the minimum data point.
- Maximum
- Specify whether to output the maximum value (specified by Statistics on) of the data points.
- X/Y at Maximum
- Specify whether to output the X coordinate (if Statistics on = Y Value)/ Y coordinate (if Statistics on = X Value) of the maximum data points.
|
Context Menu in Lower Panel
Results of all the plots in the graph are listed here in rows. Different quantities of statistics results are listed in different columns.
Context menu brought up by right-clicking any column title
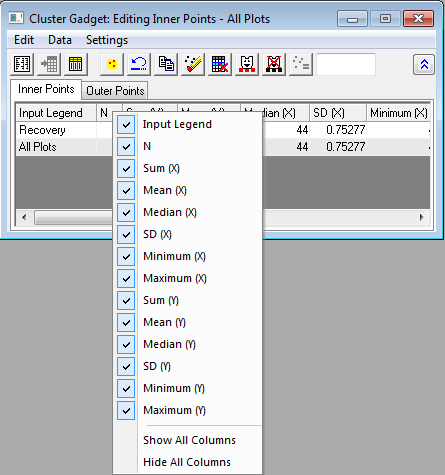
Right-click on any column title to bring up the context menu to specify what kind of statistic results shown here.
| Right-clicking menu list includes "Z" stats for an XY scatter plot that is color-mapped to a Z column of values.
|
Context menu brought up by right-clicking any cell
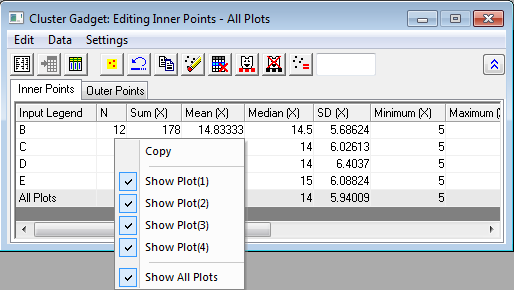
Right-click on the cells to bring up context menu and select displaying statistic results for which plots
| Notes: The plots you manipulating on are controlled by Data menu, not the context menu here.
|
ROI Fly-Out Menu
Click the triangle button  beside the top right corner of the ROI to open the fly-out menu. If you do not see the button, you can enable it by doing one of the following: beside the top right corner of the ROI to open the fly-out menu. If you do not see the button, you can enable it by doing one of the following:
- From the main menu choose Gadgets: Cluster. On the ROI Box tab, check the Show Close Button and Context Menu box.
- If the Cluster Gadget tool is open, click Settings and verify that Show Attached Buttons is checked.
Fly-out menu commands are as follows:
| New Statistics Output
|
Select the option to output the results to what are specified in Output To tab of Cluster Manipulation Preferences dialog.
|
| Go to Report Worksheet
|
Go to the results worksheet. It is only available after the report worksheet has been created.
|
| Go to Source Worksheet
|
Go to the worksheet for the selected data points. If the plots come from different worksheets, it will go to the worksheet of the first selected plot.
|
| Output to Clipboard
|
When selected (menu item checked) New Output will be placed on the Clipboard.
|
| Change Data
|
Select data plots and ROI or non-ROI.
- Plot(n)
- Select the nth plot in the active layer.
- Show Locked Analysis Plot(s)
- Determine whether to show locked analysis plot(s) in the fly-out menu.
- All Plots
- Select all plots listed in the fly-out menu. Note that if locked analysis plots are not shown in the menu, they will not be selected.
- Inner Points
- Select data points in the ROI. When it is checked, Outer Points will be cleared. And the dialog's title will be updated to show "Editing Inner Points".
- Outer Points
- Select data points out of the ROI. When it is checked, Inner Points will be cleared. And the dialog's title will be updated to show "Editing Outer Points".
|
| Expand to Full Plot Range
|
Expand the ROI range to fit all selected plots.
|
| Expand to Full Layer Width
|
Expand the ROI's width to the selected layer's width.
|
| Expand to Full Layer Height
|
Expand the ROI's height to the selected layer's height.
|
| Use Circular ROI Box
|
Specify whether to use a circular ROI.
|
| Save Theme
|
Save the current dialog's setting as a theme, which will open the Theme Save as dialog, and you can specify the theme name in the edit box.
|
| Save as <default>
|
Save the current dialog's setting as the default theme.
|
| Load Theme
|
Load a theme from its theme list.
|
| Preferences
|
Bring up the Cluster Manipulation Preferences dialog for customizing the gadget.
|
Example
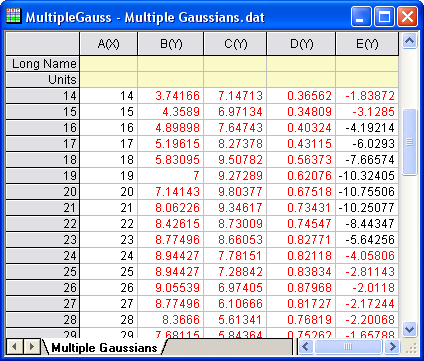
- Create a new worksheet and import the data file Multiple Gaussians.dat, which is located in the folder <Origin Program Folder>\Samples\Curve Fitting.
- Highlight the entire worksheet and from the main menu, select Plot: Basic 2D: Scatter.
- Select Gadgets: Cluster from the Origin menu. Keep the default settings and click OK. A yellow ROI object is added to the plot, the color of the selected scatter points is changed, and the Cluster Gadget opens.
- Select Settings: Show Attached Buttons from Cluster Gadget dialog's menu. A Close button and context menu will be shown in the top right corner of the ROI.
- Move the ROI and see how the results change.
- Click Mask Data Points button in the Cluster Gadget dialog to mask the data in the source worksheet. You will find that the inner points in the source worksheet have been masked.
For more instruction in use of the Cluster Gadget, see this tutorial.
Algorithm
This tool performs descriptive statistics on the curve in the graph window. For more information about calculation, please refer to the algorithm of X-Function stats.
|