10.1.8 Translating a CurveTranslate-Curve
This tool is used to move the active curve vertically or horizontally.
To use this tool:
- Make a graph active.
- Select Analysis: Data Manipulation: Vertical Translate or Horizontal Translate from Origin menu.
or
Select Gadgets: Curve Translate
This tool will add an anchor and a red line to the active curve.
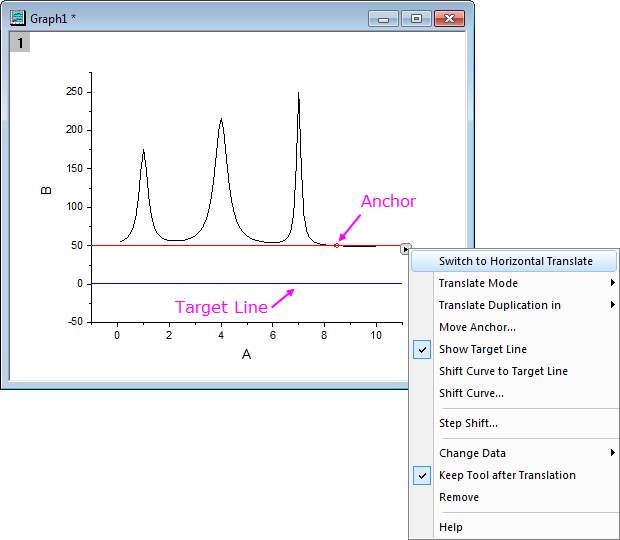
This tool can add a red line with an anchor (a small red ring) to the active curve to allow moving the entire active data plot horizontally or vertically. The moving direction depends on whether horizontal translate or vertical translate is selected.
You can click on the anchor line and drag it to move the active data plot to a new position. Moreover, you can set the new position by dragging the anchor on the line. The anchor always snaps to the active curve when you move the line.
If you drag the plot to a new position but want to cancel the moving, do not release the left mouse button and press the right button. Then release the right button, and then left button. The curve stays put.
Note: when you translate a curve, the source data for the curve also will be changed.
Fly-out Menu
| Switch to Vertical/Horizontal Translate
|
If you are using Vertical/Horizontal Translate, use this item to switch to Horizontal/Vertical Translate.
|
| Translate Mode
|
- Stack Offset
- Only shift current curve for display purpose. Just like choose Individual in Stack tab and then set offset in Offset tab in the Plot Details dialog. Please note that this item is selectable only when there are multiple plots in the current layer and the current plot has been grouped with other plots.
- Update Data
- This is the default mode. If this option is selected, when translate the current plot, the source data will be changed.
|
| Translate Duplication in
|
Only available when the Translate Mode is set to Update Data. When you select Translate Duplication in New Columns/Sheet/Book, the raw data of current curve is duplicated to new columns/sheet/book, and the duplicate one will be updated when moving the plot. If you don't select Translate Duplication in New Columns/Sheet/Book, moving the plot to a new location will change the raw data in the source worksheet.
|
| Move Anchor...
|
Opens the Move Anchor dialog box. It allows you to move the anchor to a specific position by data index or value.
More detail see this
|
| Show Target Line
|
Specifies whether to show the target line. When the target line is shown, you can drag-n-drop the target line to the desirable position, and then select the Shift Curve to Target Line menu item to move the curve to the position defined by the target line.
|
| Shift Curve to Target Line
|
This is only enabled when the target line is shown. When selected, it will translate the current curve to the target line's position.
|
| Shift Curve
|
This opens the Shift Curve dialog to allow moving the anchor line (so as the curve) by a specified value or to a new position at a specified value.
|
| Step Shift
|
This opens the Step Shift dialog allowing you to specify a step size on each translation.
More detail see this
|
| Change Data
|
Change the active plot to do translation. When you select a plot from the fly-out list, the anchor line will move to the position of the new plot.
|
| Keep Tool after Translation
|
Specify whether to keep this tool after the translation is performed.
|
| Remove
|
Specify whether to remove curve translate tool from the graph.
|
| Help
|
Click to open the document of this tool.
|
More Anchor dialog
In the fly-out menu, select More Anchor... to open this dialog.
It allows you to move the anchor to a specific position by data index or value.
Note: If move anchor to a position by the specific value, the anchor just will move to the data value that is closest of the specific value.
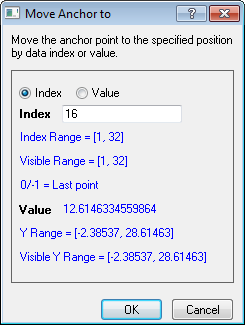
You are also allowed to enter a LabTalk expression or an expression that incorporates one of Origin's built-in statistical functions, see the details UserGuide:Reference_Lines#At_Axis_Value_2 here. Please note, when there is not a point located at the value, the anchor will be moved to the most neighboring point.
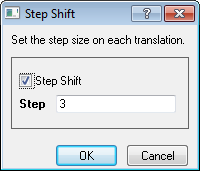
Step Shift dialog
In the fly-out menu, select Step Shift to open this dialog to set the step on each translation. Each time you drag the anchor line, it is moved by the multiple of the step size which is closest to the difference X (if horizontal translate is selected) or Y (if vertical translate is selected) between the original and moved positions.
Example
This example will show to how to move the curve vertically with two different modes: Data Update and Stack Offset. Translate the first curve with the mode Data Update and the second curve with mode Stack Offset.
- Click the New Workbook button
 on the Standard toolbar to create a new workbook. on the Standard toolbar to create a new workbook.
- Click the Import Single ASCII button
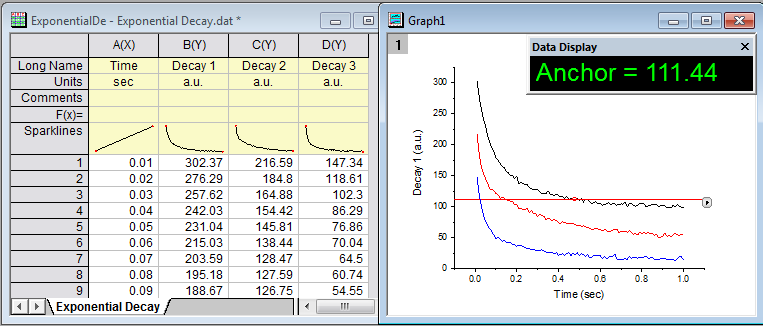
 the Standard toolbar. Import file Exponential Decay.dat in <Origin Program Folder>\Samples\Curve Fitting. the Standard toolbar. Import file Exponential Decay.dat in <Origin Program Folder>\Samples\Curve Fitting.
- Highlight col(B)~col(D). Select Plot: Line: Line from the main menu to plot a graph.
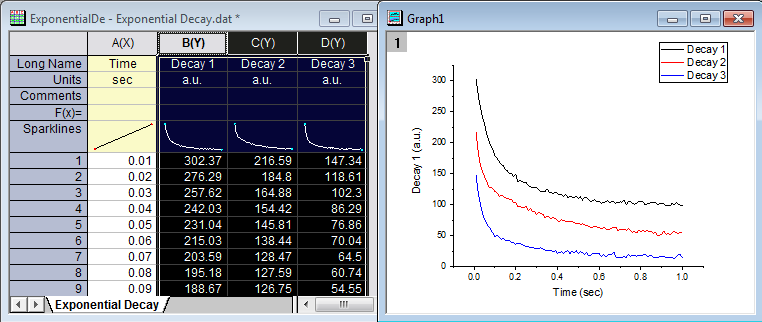
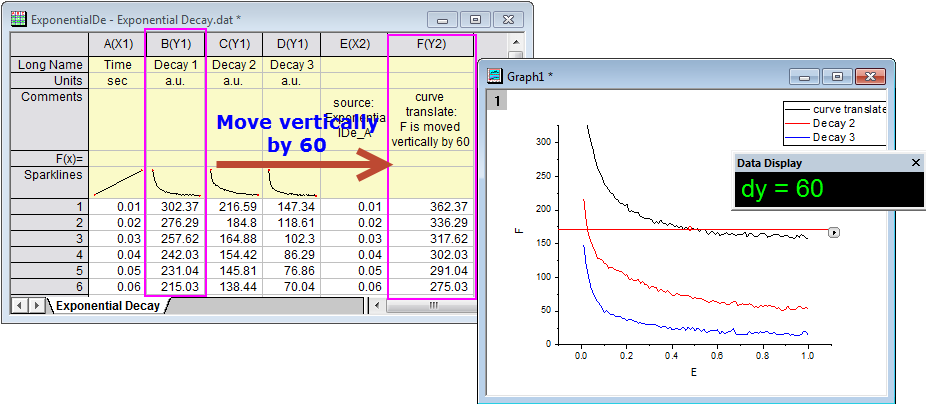
- With the graph active, select Analysis: Data Manipulation: Vertical Translate from the menu. The red line with a anchor at the intersection is added to the graph. You can see the Y coordinate of the anchor in the Data Display window.
- Click the triangle button
 on the anchor line. A short-cut menu appears. on the anchor line. A short-cut menu appears.
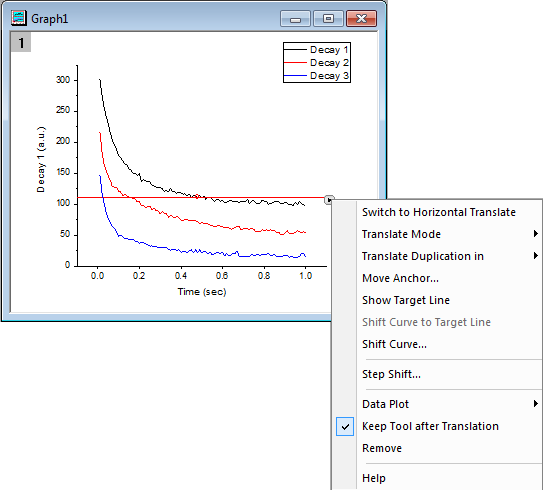
- Select Step Shift to bring up the Step Shift dialog box. Check Step Shift. Enter 30 in the Step edit box. Click the OK button.
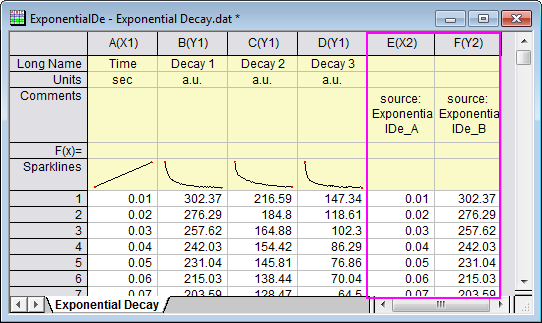
- Click the triangle button again to select Translate Duplication in: New Columns from the menu. Another two columns will be added and the source data of current curve will be copied to these two new columns.
- Click the anchor line and drag it upward until you see Target Y=171.44 in the Data Display window.
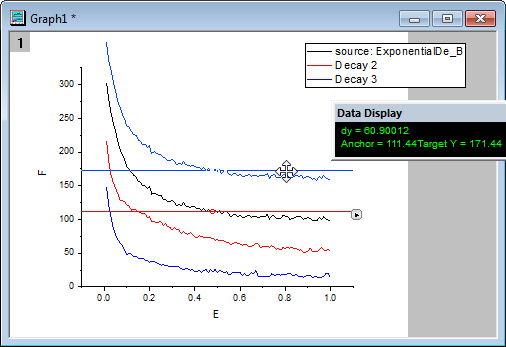
- Release the mouse. You will see the curve were moved vertically by 60. From the Data Display, you can see dx=60. (The multiple of 30 which is closest to 60.90012 is 60, so Origin moved the curve by 60.) Note that the col(E) and col(F) in the source worksheet has been updated accordingly.
- Click the triangle button to select Data Plot: Plot(2) from the menu to change the active plot. The anchor line will moved to the position of second plot.
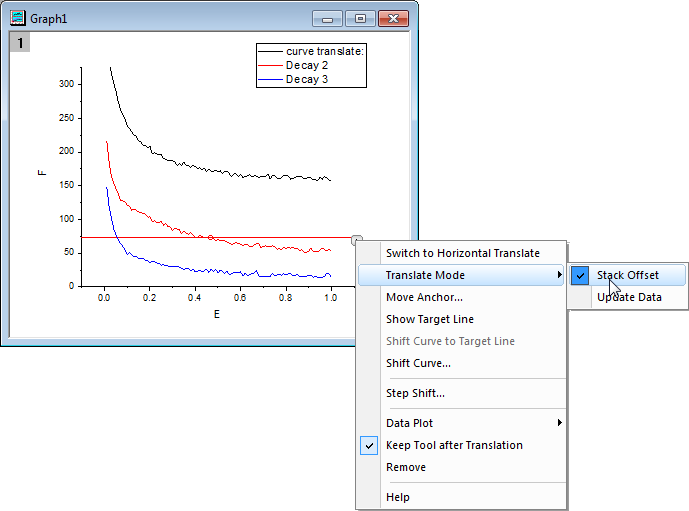
- Click the triangle to select Translate Mode: Stack Offset from the menu to change the translate mode.
- Click the triangle button to select Step Shift. In the Step Shift dialog that opens, check Step Shift. Enter 30 in the Step edit box. Click OK button.
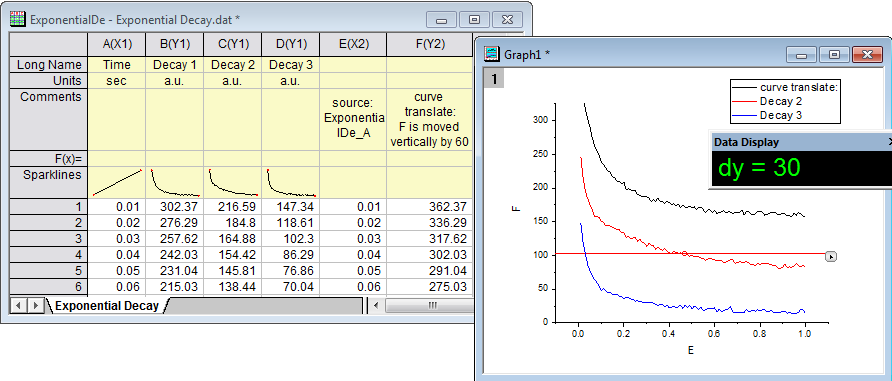
- Click the anchor line and drag it upward until you see Target Y=102.72 in the Data Display window.
- Release the mouse. You will see the curve were moved vertically by 30 and the data in source worksheet isn't changed.
- Click the triangle button to select Remove to exit this tool.
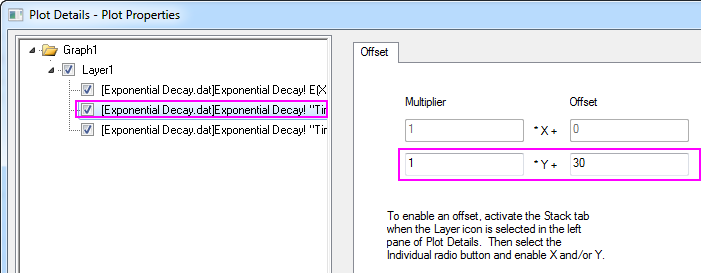
- Select Format: Layer... from main menu to open the Plot Details dialog. Go to the Stack tab, you will see the Offset radio box has been set to Individual and the check box Y has been checked as below:
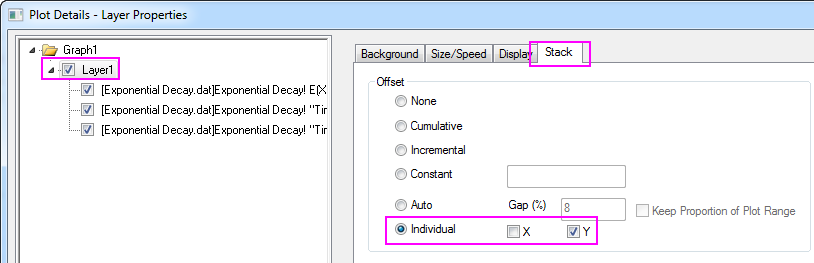
- Select the second plot in the left panel and go to Offset tab, you will see the Y Offset has been set to 30.
|