10.1.7 Detecting OutliersDetect-Outlier
An outlier is statistically an observation which is numerically distant from the rest of the data. Origin provides methods and tools to help finding and testing for outliers.
To determine whether there is an outlier in a data set from repeated measurements, tools for Grubbs test and Dixon's Q test are available, and it's also possible to roughly visualize the outlier using the Q-Q plot.
To detect an outlier from regression, you may use the standardized residuals.
Once you’ve statistically determined if a point is an outlier, you can then mask the point using the Regional Mask Tool button, , on the Tools toolbar. , on the Tools toolbar.
Grubbs Test
For a series of repeated measured data listed in a column, in order to detect if there is an outlier or not with Grubbs Test:
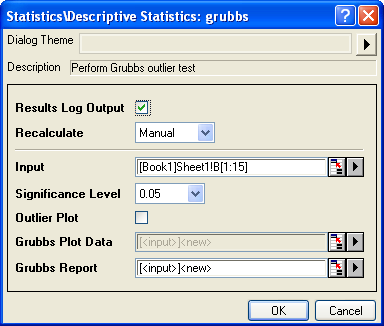
- Select from menu Statistics:Descriptive Statistics:Grubbs Test to open the grubbs dialog.
- Select the input data range, significance level and other settings, click OK.
or
- Open the Command Window.
- Call the X-Function grubbs directly.
The result will be output to both Result Log and Command Window, a report sheet will also be generated and if Outlier Plot is selected, a worksheet with plot data will also be generated:
| ox
|
The value of the suspected point
|
| index
|
Row index of suspected point
|
| gstat
|
The calculated g value from suspected point
|
| critical
|
The critical g value at the specified significance level
|
| pval
|
The p value for the test
|
| sig
|
sig=1 means there is an outlier, sig=0 means there is no outlier
|
| conclusion
|
A statement of conclusion indicating the statistical result.
|
| rd
|
The worksheet range to put the plot data for outlier plot, if the Outlier Plot option is selected.
|
| rt
|
The worksheet range to put the report table.
|
Dixon's Q Test
For a series of repeated measured data listed in a column (Sample size from 3 to 10), in order to detect if there is an outlier or not with Dixon's Q Test:
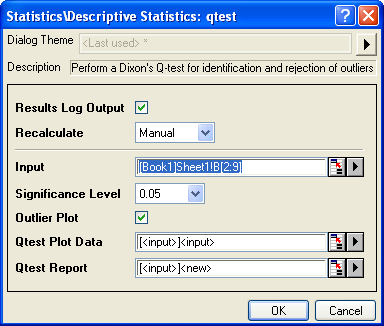
- Select from menu Statistics:Descriptive Statistics:Dixon's Q Test to open the qtest dialog.
- Select the input data range, significance level and click OK.
or
- Open the Command Window.
- Call the X-Function qtest directly.
The result will be output to both Result Log and Command Window:
| ox
|
The value of the suspected point
|
| index
|
Row index of suspected point
|
| qstat
|
The calculated Q value from suspected point
|
| critical
|
The critical Q value at the specified significance level
|
| sig
|
sig=1 means there is an outlier, sig=0 means there is no outlier
|
| conclusion
|
A statement of conclusion indicating the statistical result.
|
| rd
|
The worksheet range to put the plot data for outlier plot, if the Outlier Plot option is selected..
|
| rt
|
The worksheet range to put the report table.
|
Detect Outlier with Residual Plot
You can perform a regression (Linear, Polynomial or Nonlinear Curve Fitting), and then use the standardized residuals to determine which data points are outliers.
The following short tutorial will show you how to make use of residual plot to detect outlier:

|
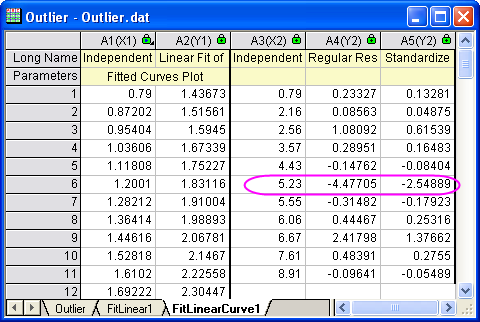
- Start with a new workbook and import the file \Samples\Curve Fitting\Outlier.dat
- Click and select the second column and use the menu item Plot : Symbol : Scatter to create a scatter plot.
- With the graph active, use the menu item Analysis : Fitting : Linear Fit to bring up the Linear Fit dialog. Note that if you have used the Linear Fit dialog before, there will be a fly-out menu and you need to select the Open Dialog... sub menu.
- Expand the Fit Options tree node in the dialog, and uncheck the Apparent Fit check box.
- Expand the Residual Analysis tree node in the dialog, and check the Standardized check box.
- Change the Recalculate drop-down at the top of the dialog to Auto and press the OK button at the bottom of the dialog. The dialog will close and linear regression will be performed on the data.
- Select the FitLinearCurves1 result sheet in the data workbook and scroll to the right side to view the Standardized Residual column. You will note that the value in row 6 in this columns is -2.54889, hence this data point is an outlier:
- Make the graph active and then click and hold down the mouse left button on the Regional Mask Tool button in the Tools toolbar. Select the Mask Points on Active Plot submenu which will be the first item in the fly-out menu:
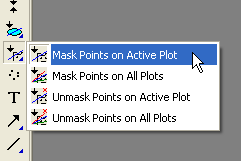
- With the above submenu selected, go to the graph and click on the 6th data point to mask the point. This changes the input data to the linear fit operation and the auto update mechanism will trigger. The linear fit will be repeated with this particular masked point left out. The fit curve in the graph and the pasted parameters will automatically update. Your result graph should then look like below:
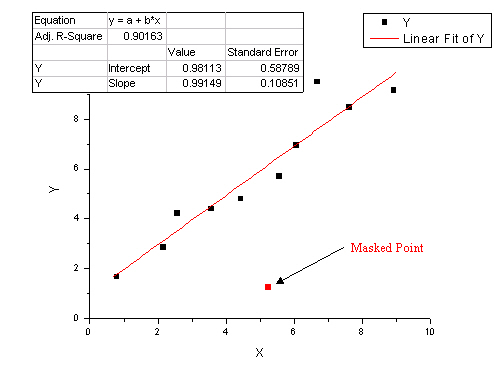
|
|