9.3.1 Customizing Data Plot ColorsCustomize-PlotColor
When we talk about "customizing" data plot colors in Origin, we could be talking about changing the default plot color assignment in an existing graph; or we could be talking about building a custom color list for use in a as-yet-to-be-created graph. Since it is difficult to talk about one without the other, this page will assume a broad definition of "customization".
If you are actively changing the color scheme of an existing graph, you will quickly become familiar with what we call the Color Chooser. That is the first topic that we discuss.
In addition to topics discussed on this page, you may want to see these pages for information on customizing plot colors.
Opening the Color Chooser
The Color Chooser is the starting point for customizing plot colors in the active graph window. You can open it in several ways:
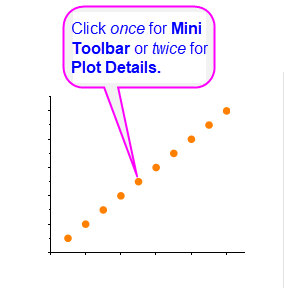
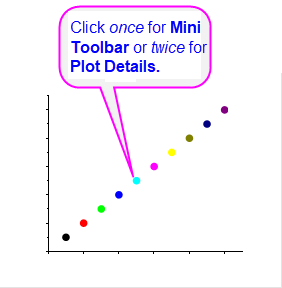
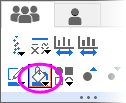
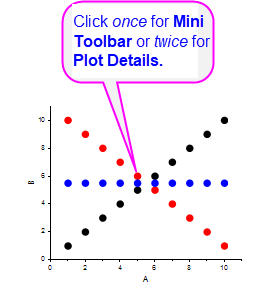
- Click on a plot and select a color-related button from a Mini Toolbar.
- Double-click on the plot to open Plot Details and initiate color editing via the color button for a particular element (e.g. Fill Color).
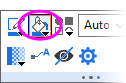
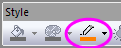
- Click on a plot and select a color-related button on the Format toolbar (docked at the top of your workspace).
|
|
Sample Plot
|
Plot Details Color Button or Toolbar Button
|
Color Chooser View
|
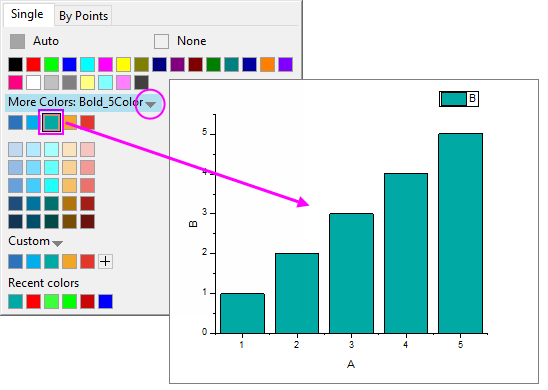
| Plot elements of a SINGLE color
|
|
- or...
- also...
|
Related topics:
Plot Details Symbol Tab Controls
|
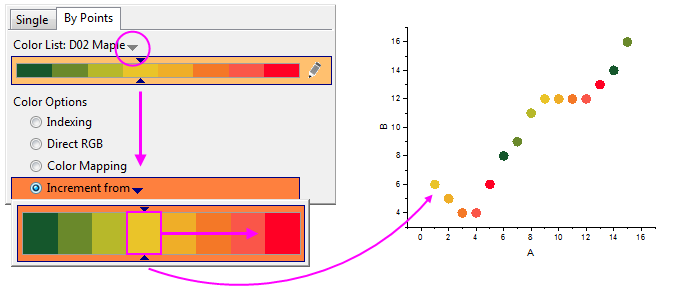
Plots set to vary color
BY POINTS
|
|
- or...
- also...
|
Related topics:
|
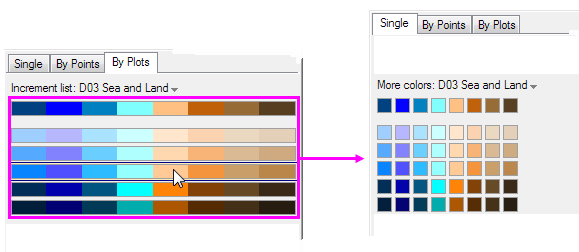
Plots set to vary color
BY PLOTS
|
|
- or...
- also...
|
Related topics:
|
 | - You can display RGB values on the color button by setting system variable @RGBS to 1.
- You can use function color() to return the corresponding RGB composite value for a specified html color code.
|
Defining and Using Custom Colors
Origin's Default Color List
Origin has a very basic, non-customizable "system" color list which has been kept primarily for reasons of backward compatibility and for programmatically assigning color. That color list can be found in the LabTalk Reference table "List of Colors".
The GUI user needn't be concerned with this color list as the Color Chooser and Color Manager both give access to Origin's large number of built-in Color Lists, any of which can be customized and saved as an Increment List (.oth file) to your \User Files\Themes\Graph folder. In addition, Origin supports several other methods for adding custom color lists to the software, including by drag-and-drop of standard color palette files.
| When publishing an article, you may be asked to submit color images from which both color (e.g. online) and black and white (e.g. print) images will be produced. To verify that your color list provides sufficient plot differentiation, you can preview it in grayscale. Choose File: Print Preview and click the Grayscale  button. button.
|
Defining a Custom Color
This method is useful for creating one or several custom colors for use with the current plot. For information on picking a series of custom colors to be saved for later use, see the next topic.
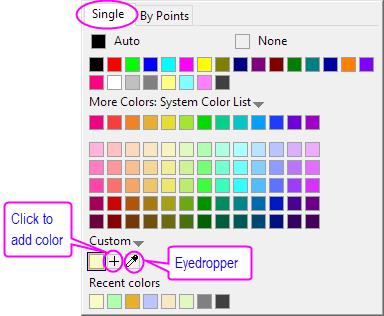
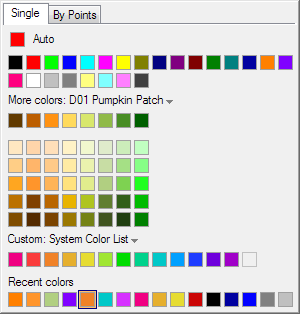
- To define a single, custom color, open the Color Chooser and click on the Single tab.
- Click a blank color well
 under Custom to open the Colors dialog, and then go to Custom tab. under Custom to open the Colors dialog, and then go to Custom tab.
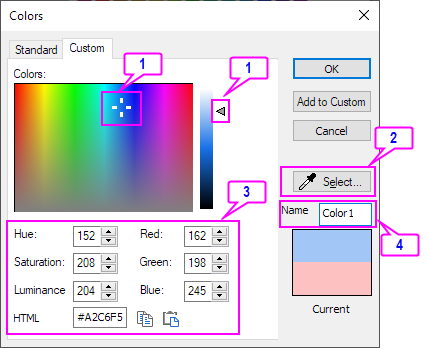
- Define your color by doing one of the following:
- Manipulate the cross-hair and slider to pick a color.
- Click the eyedropper tool, then click on the desired color in another portion of your Origin workspace.
- Enter values for RGB, HSL or HTML (hex) color in edit boxes.
- Optionally, enter a name for the user-defined color (if unnamed, the GUI displays a hex color code).
- When finished, click Add to Custom.
- Also, you can click the eyedropper
 , then click on the desired color in another portion of your workspace. , then click on the desired color in another portion of your workspace.
The color is added to the Color Chooser Custom group. Add more colors, as needed. Note that you can use the Add to Custom button to add a sequence of colors without closing the Colors dialog.
other things to note ...
- To modify an existing Custom color, CTRL+click on a color well and use the Colors dialog box.
- To fine-tune a previously-applied custom color, click a blank well in Custom group and use available controls (crosshair, slider, RGB, etc) to modify it.
- Colors in both Custom and Recent Colors groups are automatically preserved across sessions (i.e. they will be there the next time you start Origin).
- To apply a series of custom colors as a group (e.g. to apply color By Points in a plot), you must save them as an Increment List (see below).
- If, before saving a list of custom colors, you load another color list, you can restore the previous list of colors by clicking the Custom menu and selecting Last Custom Colors.
Saving a Series of Custom Colors as an Increment List
The terms "color list" and "increment list" are sometimes used interchangeably in the Origin software documentation. To be more precise, an "increment list" is simply a "color list" that has been used to assign color to series of data points or plots, in a sequential fashion.
There are a couple of ways to create an increment list (color list) -- whether you intend to use it as an actual increment list, or for assigning plot colors by mapping, indexing, etc.
Building a Color List, One-by-One
This is the more-tedious of two methods. If you have Origin 2021 or later, see section immediately below this.
- Before defining a series of custom colors to be saved as a list, you may want to clear the color wells. Click the Custom menu, then click Clear.
- Define your list of colors using the procedure described above.
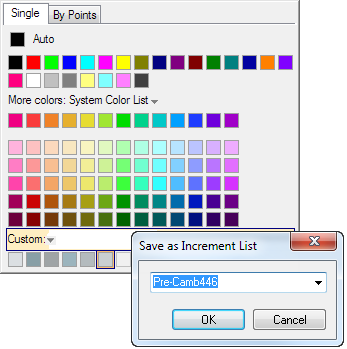
- When you have completed filling the wells with your sequence of custom colors, click the Custom menu again and choose Save As ...
- Enter a name in the Save As Increment List dialog and click OK. Note that you can click the drop-down list in this dialog and save the current selection to a previously-created list.
Building a List with the Build Colors Dialog Box (Origin 2021 and Later)
Beginning with Origin 2021, you can use the Build Colors dialog to build a color list. See this topic for details.
| Beginning with Origin 2021b, the Increment Editor is replaced by the Build Colors dialog, for editing of color properties. Build Colors offers more features but if you prefer Increment Editor, you can restore it by setting system variable @DICE = 0. For information on changing the value of a system variable, see FAQ-708 How do I permanently change the value of a system variable?
|
Create Color List from Column
When Format of columns is set to Color in the project, the option to Create Color List from Column shows under the Custom menu of the Color Chooser.
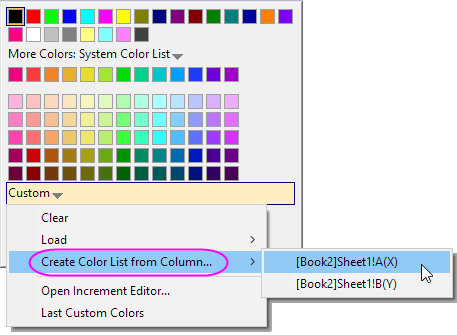
- Select a color format column under Create Color List from Column. The color in the column will be added into the Custom color and the Save as Increment List dialog opens.
- Give the color list a name and click OK.
Working with Color Increment Lists and Palettes
Using a Saved Increment List
You can load a saved list from any of the three Color Chooser tabs - Single, By Points or By Plots (note that not all plots will display all three tabs).
- Single: Click the list control (downward pointing arrow) to the right of More Colors.
- Choose a color list and click one of the available color wells.
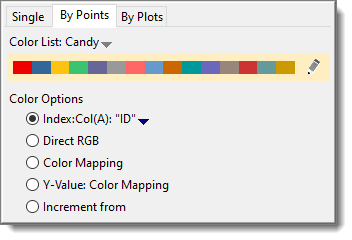
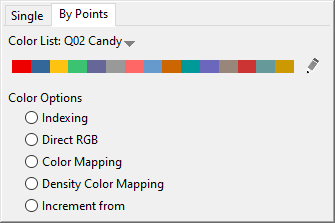
- By Points: Click the list control beside Color List.
- When incrementing color By Points, change the starting color by moving the Increment From slider. If the list is exhausted before color is applied to all points, the code cycles back to the beginning of the list.
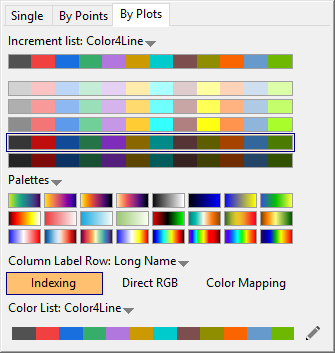
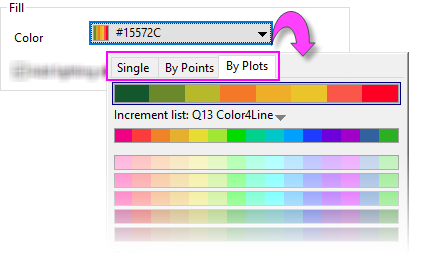
- By Plots: Click the list control beside Increment List.
- When you are on the By Plots tab of the Color Chooser and you select a new Increment List (other than Q02 Basic), you are presented with a list of variants. These are "tint and shade" variants and you click on one of the variants to apply the color variants in that list, to your plots. The same list of tint and shade variants can be loaded from the Single tab, though these variants appear as individual blocks and colors can only be applied singly.
The Build Colors Dialog
Any color list (built-in or user-defined) can be loaded from any Color Chooser tab and edited using the Build Colors dialog box.
Loading an Increment List
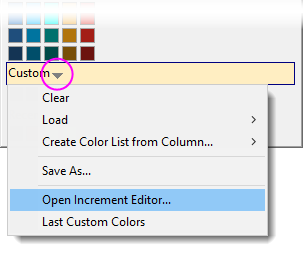
- Single (Custom Lists only): Click the Custom menu and choose Open Increment Editor. This loads the current list of Custom colors, into the Build Colors dialog.
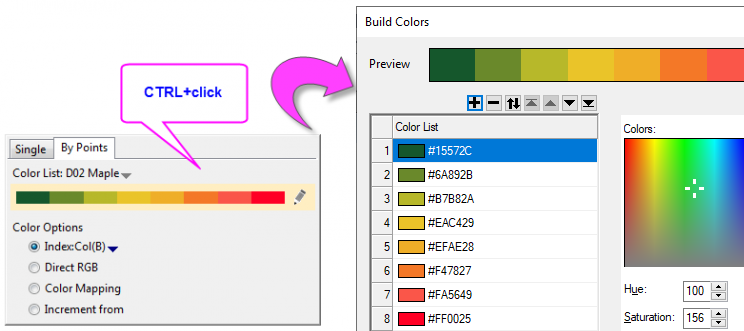
- By Points or By Plots: CTRL + Click directly on a color list (including tint/shade variants or palettes); or click the
 button at the end of the color list. This opens the color list or palette in the Build Colors dialog. button at the end of the color list. This opens the color list or palette in the Build Colors dialog.
Modifying the Increment List
Use the Build Colors dialog to modify an increment list and save it as a new increment list (see below).
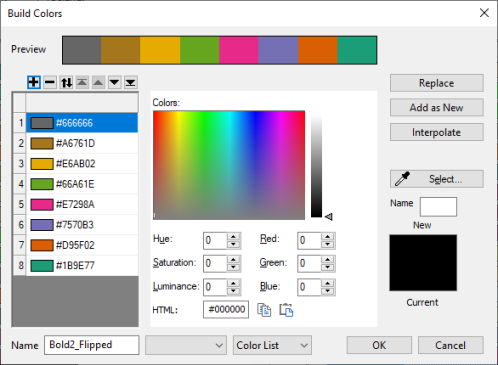
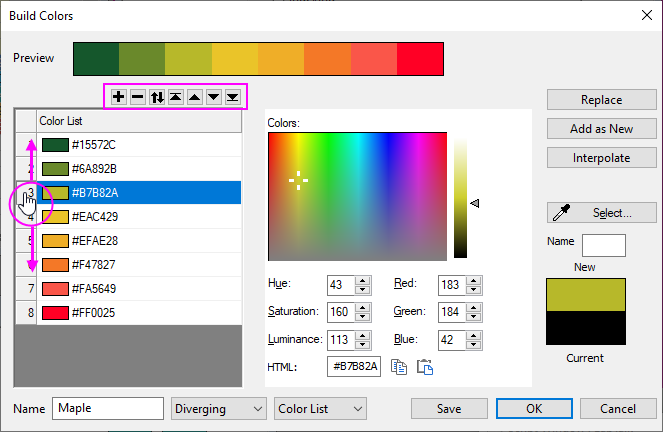
Rearranging a list
- Use the Flip, Move to Top, Move up, Move Down, and Move to Bottom buttons to change the order of the color list. Alternately, you can drag to change list order.
Add a color to the list
- Click the Add button
 or right-click on the list and choose Add. A black (#00000) cell will be appended to the bottom of the list. or right-click on the list and choose Add. A black (#00000) cell will be appended to the bottom of the list.
- To edit the added cell, make sure it is highlighted then pick a custom color by using the RGB/HSL/HTML edit boxes; or use the eye-dropper to sample a color in the Origin workspace.
- Use the New/Current blocks to compare colors. When you have decided on a color, click the Replace button to replace the black, placeholder cell.
Delete a color from the list
- Highlight a color and click the Delete button
 , or right-click on a list member and choose Delete from the shortcut menu. , or right-click on a list member and choose Delete from the shortcut menu.
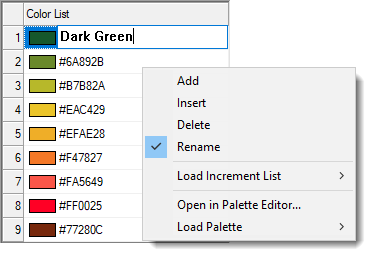
Rename colors
Some users prefer a natural language name in place of html color codes (hex codes).
- To rename colors, right-click on the color list and choose Rename (be patient as this is slow to engage).
- Click on a cell to enter renaming mode. Note that this mode stays in effect until you clear the check box beside Rename.
Saving the Increment List
- If you have used Build Colors to create a new increment list, clicking OK will save the color list and close the dialog box.
- If you have used Build Colors to modify an increment list:
- Give the modified list a Name. To keep the original (unmodified list), enter a new Name.
- Click Save before you click OK. Failing to Save will result in lost modifications.
Note that increment lists are saved as .oth files, to the \User Files\Themes\Graph folder. Once saved, these increment lists become available throughout the user interface and can also be accessed in the Theme Organizer.
Editing a Palette
Palette files generally display more color variations than do color lists, though what actually distinguishes the two is the way they are saved. Color lists (increment lists) are saved to User Files\Themes\Graph as .oth files (Theme files). Palette files are saved to User Files\Palettes as .pal files.
Load a Palette for Editing
- From the main menu, choose Tools: Color Manager.
- Click on the Palettes radio button, right-click on an editable palette (hint: system palettes are not editable but you can duplicate them and edit the duplicate) and choose Edit Color.
Alternately:
- At the top of the Color Manager, click on the New button.
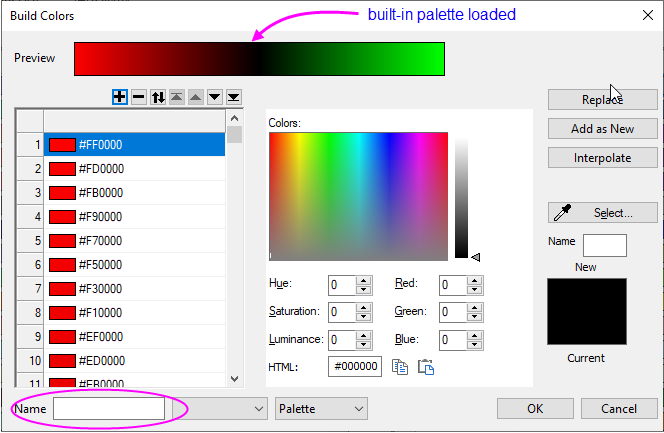
- In the Build Colors dialog, right-click on the list in the left pane and Load a Palette.
Editing a Palette
Note that you cannot edit one of Origin's built-in color palettes but you can load the palette and save it with a new Name.
- The simplest palette editing can be done by loading an editable palette, then in the Build Colors dialog, clicking the Interpolate button. Specify an Interpolation Type and No. of Colors (256 max) and click OK.
- For more complex editing, you can right-click on the color list in Build Colors, choose Open in Palette Editor to open the palEdit dialog box.
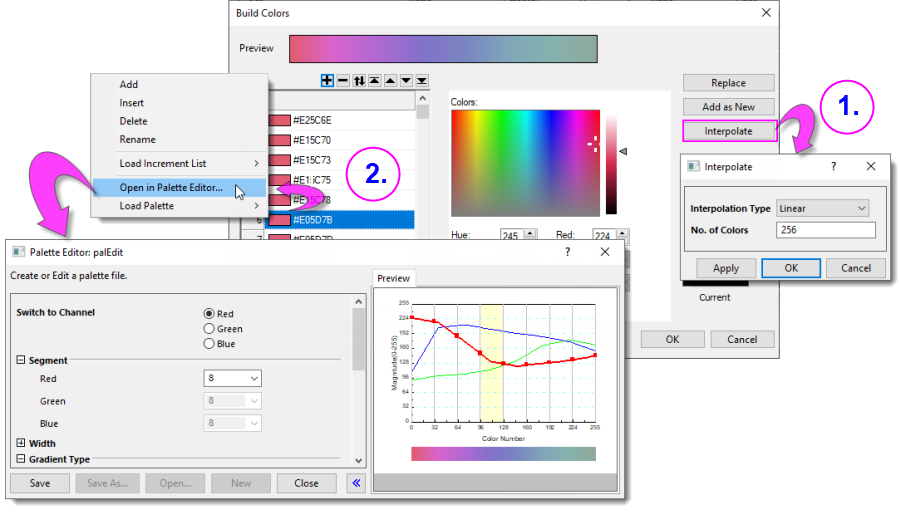
| System variable @ECD can be used to control which palette editor opens when choosing Open in Palette Editor in step 2 above.
|
For information on editing, saving and importing .pal files, see these topics:
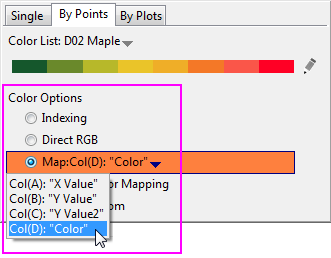
Using Column Values to Apply Color By Points
When you are on the By Points tab of the Color Chooser, you have a number of options for applying color to the data points in a plot. The most basic choice, Incrementing, allows you to set a starting color for the first data point, then assign colors from a color list, to subsequent points. See the "By Points" discussion under Using a Saved Increment List.
Other options allow you to use a dataset to apply color to the plot: (For an overview, see Using a Dataset to Control Plot Color).
- Indexing. Uses a dataset of integer or categorical values to apply color. See Indexing.
- Direct RGB. Uses an RGB composite value to apply color. See Direct RGB
- Color Mapping. Uses a dataset of real numbers to map ranges of values to a color scale. See Color Mapping
- Density Color Mapping. Used only with the Density Dots scatter template.
- Y Value: Color Mapping. When there are multiple Y data plots in a graph, use the respective Y value dataset as real numbers to map ranges of values to a color scale. See Y Value: Color Mapping
- Y Value: Plus-Minus-Total. Only available for Bridge chart (also called McKinsey-style waterfall plot). It fills column/bar colors according to the condition whether the data point Y value is Positive, Negative or Total. The Total can be set in Data Indices for Total/Subtotal option on Bridge Chart tab. You can see the fill color sequence in Color List at the bottom. Note that only the first 3 colors will be used for Y Value: Plus-Minus-Total option: The 1st color in the list will be assign to Positive y, 2nd color will be assign to Negative, 3rd to Total. See Y Value: Plus-Minus-Total.
| You can modify the sequence in a color list by pressing CTRL and clicking directly on the list; or by clicking the pencil icon to the right of the list. Either opens the Build Colors.
|
Density Color Mapping
One of the (color) By Points options is Density Color Mapping. Rather than use a column of values to assign color, this setting assigns color based on the density of points in a scatter plot. It is intended for use specifically with the Density Dots template for creating scatter plots of large datasets. Unless you have a scatter plot with a significant number of superimposed points, you will not find this option useful.
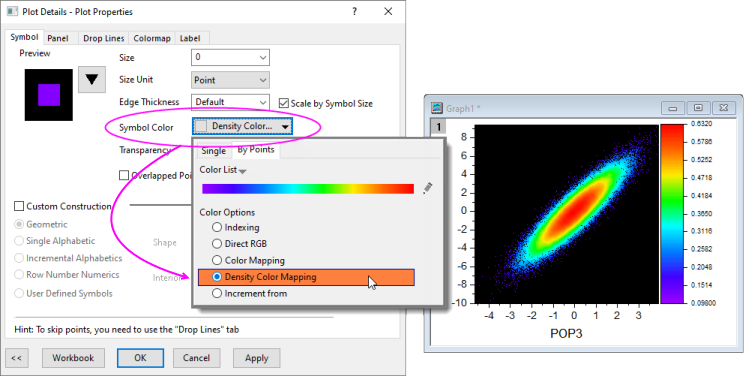
| Note: Any time you apply color-mapping to a dataplot, a Colormap tab is added to Plot Details and it is on the Colormap tab -- not the Symbol tab -- that you control how color is applied to the plot.
|
Using Column Label Row Values to Control Plot Color
Besides using column indices to apply a color list to grouped plots, for grouped 2D graph, you can use the actual values of one column identifier(one column label row) to vary the grouped plots in color.
To use column label values to color-map grouped plots,
- plot all these Y columns as 2D graph,
- Click on one plot, in the popup mini toolbar, go to the Group tab, click Fill Color, Border Color or Edge Color botton to expand the color chooser. (You can also double-click on the plot to open Plot Details dialog, go to the relative tab to click the color button.)
- Click Column Label Row button to select a column label row. And then, in the expanded panel, choose a method to map the colors to the column label row values.
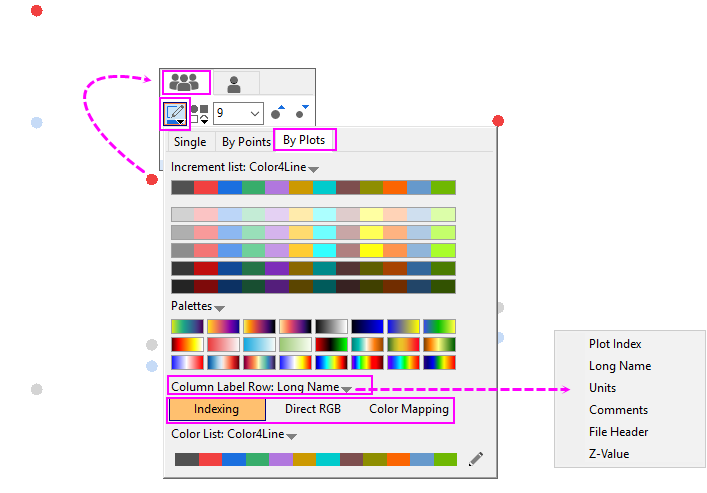
Note: Under the Column Label Row list, Plot Index means the index number of the plots; Z-Value is only availiable for waterfall graphs, which is used to let the line colors map to the column label row specifed by Z Value Source option.
Choose a method to map the colors with the values stored in the specified column label row:
- Indexing: Use the values in the selected column label row to index the colors of grouped plots in a specific Color List.
- Direct RGB: Treat the selected column label row as a group of RGB values to apply colors to grouped plot.
- Color Mapping: Create a mapping relationship between the selected Z values and an associated scale of colors. The color will then be applied to the grouped plots according to its column label row Values.
To learning the details about these three methods, please refer to the page "Using a Dataset to Control Plot Color"
What is "Auto" Color?
Some color buttons display Auto, by default.
When Auto shows on the button, color is applied in this way:
| When color = Auto, this element...
|
...follows this setting:
|
|
(Fill) Pattern Color
|
(Border) Color
|
|
(Drop Lines) Color
|
Symbol Color
|
|
Symbol Color
|
(Line) Color. If the data plot does not include a Line tab, then display Black.
|
|
(Symbol) Edge Color
|
(Line) Color. If the data plot does not include a Line tab, then display Black.
|
|
(Symbol) Fill Color
|
Default Symbol Fill Color list selection on the Graph tab of the Options dialog box.
|
|
(Error bar) Color
|
Border Color. If no symbol (scatter, column, etc.) exists, follow (Line) Color.
|
Some of Origin's color buttons and color lists also include a None option. When you select None, the data plot element is transparent.
|