9.8 Using Graph Options dialog to set graph defaultGraph-Options-Set-Graph-Default
Besides using Theme Organizer to apply the styles/formats to the graphs globally, you can also use Graph Options dialog to change the default format/styles of the graphs.
- Choose Preferences: Graph Options on main menu.

Note: By default, some default settings have been pre-shipped with a global system theme. You can see some options showing as Auto. Once a setting has been changed in Graph Options dialog, it will have higher priority than the system default theme, and will be applied to system built-in templates, but not for user templates.
 | In this dialog, there are several checkboxes, which have 3 states:
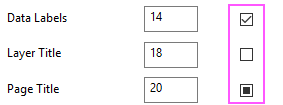
- Checked: Turn this setting on as default.
- Unchecked: Turn this setting off.
- Black Square Inside: Set this option to Auto, which means using whatever is in the system theme or specified template.
|
Settings in Different Tabs
Axis
Line Thickness
Change the line thickness for the axies.
Ticks
Change the tick direction, the length of the major ticks and minor ticks. This option is only for 2D Cartesian graph layers.
Gridlines
Specify whether show gradlines for major ticks and minor ticks and the line styles for the gridlines on major ticks and minor ticks seperately.
Rotate Tick Labels if Overlapping
Specify whether rotate the tick labels if labels are overlapped. And enter a angle value to rotate the tick labels.
Type a positive number in this text box to rotate labels counterclockwise, and a negative number to rotate labels clockwise.
Show Layer Frame
Specify whether show the layer frame for current layer. This option is only for 2D Cartesian graph layers.
Show Arrow at End
Specify whether show arrow at the end of the axes. You can choose an arrow style from the following drop-down list and set the arrow size.
This option is diabled by default, enabled when the option Show Layer Frame is unchecked.
X Axis Rescale Margin(%)
This option can be used to specify whether to add padding to minimum and maximum values during X axis rescaling. This option is similar to the option Rescale Margin(%) in Scale tab of Axis dialog.
Fonts
The options in this tab are used to control the font and boldness for different text objects on the graph. The settings will affect both the existing objects and default style of adding new objects.
Font
Change the font of all objects in the graph, including the graph tables.
Specific Objects
You can change the font and boldness of Tick Labels, Axis Title, Legend, Data Labels, Layer Title, Page Title, Text Objects, Annotaion, Reference Line Labels and Layer Labels.
Layout
Graph Size
Specify the graph size. The size options have the same effect as the size settings under the Dimensions group in the Print/Dimensions tab of Plot Details dialog.
Fix Scale Factor = 1
Specify whether fix the scale factor to 1.
You can refer to the option Fixed Factor in Size tab of Plot Details dialog to learn what the sacle factor is.
Gap Between Layers(%)
When there are many layers in the graph, you can use this option to specify the gap betwen the layers. The unit of this option is % of page size.
Page Margin(%)
Specify the margin for the whole graph. The unit of this option is % of page size.
By default, the page margin has been set to 3% and there will be an addtional margin for top margin in case you want to add page title or layer title.
Legend
Position
Specify where to position the legend.
Show Legend Only for Multiple Entries
Show the legend only when the number of curves in current layer is greater than 1. If there is only one dataset in current layer, no legend will show for current layer.
Show Legend Outside of Layer for Single Block
Specify whether show the legend outside of the layer for each graph layer. Uncheck this check box will show legend within the layer frame at specified position.
Direction
Specify how to arrange the legend entries, horizontally or vertically.
Show Frame
Specify whether show a frame for the legend. If the frame was shown, you can change the frame border color, border width, and fill color within the frame.
Save and Load Settings Buttons
At the top-right corner of dialog, there are two buttons: Save Settings as button  and Load Settings button and Load Settings button 
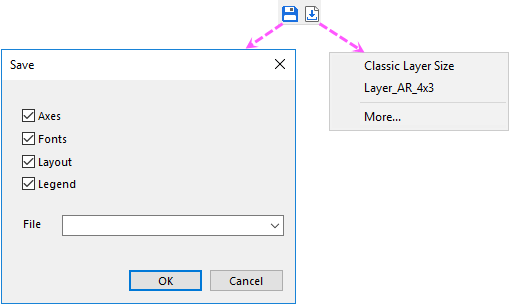
- Clicking Save Settings as… button will popup a dialog--Save--which has 4 check boxes with the tab names. By default, all these boxes have been selected. You can enter a file name at the bottom. If you unchecked any check box, the settings of this corresponding tab will not be saved to the theme file; if you load this pre-saved theme file later, the controls in that tab will be set to be Auto.
- Clicking Load Settings button will popup a fly-out list which list the theme files(.oth files) under \User Files Folder\Themes\Graph Options folder, in alphabetical order. Maximum number of theme files listed here is 10, and you also can choose More... item to open the file browser to choose other theme file. By default, \User Files Folder\Themes\Graph Options folder will be opened.
Buttons at Bottom
Apply to
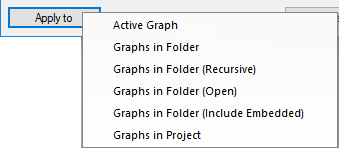
Choose the target graphs to apply the format/style settings. Active Graph is only availiable when the active window is a graph window.
Reset
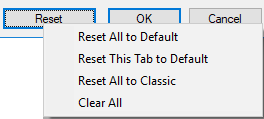
- Reset All to Default: Reset the options in all tabs current tab to roll back to default settings in system default theme.
- Reset This Tab to Default: Reset the options in current tab to roll back to default settings in system default theme.
- Reset All to Classic: Reset all options in dialog to roll back to the classic format seetings which are default settings in the older versions before 2025b.
- Clear All:Clear all settings.
|