9.1 Customizing Graph Page ElementsCustomize-Page-Element
The Plot Details dialog box page-level tabs provide controls for setting the page size, graph page drawing and redrawing behaviors, background color, the graph legend text.

Setting the graph page orientation
Graphs can be presented in landscape or portrait page orientations.
To change the page orientation of the active graph window:
- Select File: Page Setup. This menu command opens the Page Setup dialog box.
- In the Orientation group, select the Portrait or Landscape radio buttons.
or
- Right-click in the gray area outside the graph page (but inside the graph window).
- From the shortcut menu, select Edit: Rotate Page (Note that the Rotate Page shortcut menu command is applicable for Page View and Print View only -- i.e. does not apply to Draft View or Window View).
When you change the page orientation by either of the above methods, Origin reverses the Width and Height Dimensions on the Print/Dimensions tab of the page's Plot Details dialog box
Setting the graph page size
The default graph page size is determined by the printable area of your particular printer. For the most part, you won't need to change the size of the page. For instance, if you intend to insert a graph as an embedded object in an MS Word document, you can adjust the size of the embedded graph using controls in MS Word. However, if you are trying to create a graph for graphic export and you need a graph of a certain size, you will need to adjust the page size before exporting. Settings on the Print/Dimensions tab of the Plot Details dialog box control graph page size and the printing of crop marks (useful for printing graphs across multiple sheets).
To open the (Plot Details) Print/Dimensions tab:
- With the graph active, select Format: Page. This opens the Plot Details dialog box.
- Select the Print Dimensions tab if it is not already selected.
Setting graph page color
To set a page color:
- Select Format: Page when the graph window is active.
or
- Double-click in the gray area to the right of the graph page.
Both actions open the Plot Details dialog box with the graph page icon selected on the left side of the dialog box.
- Select the Display tab on the right side of this dialog box and use the Background controls to set the page color.
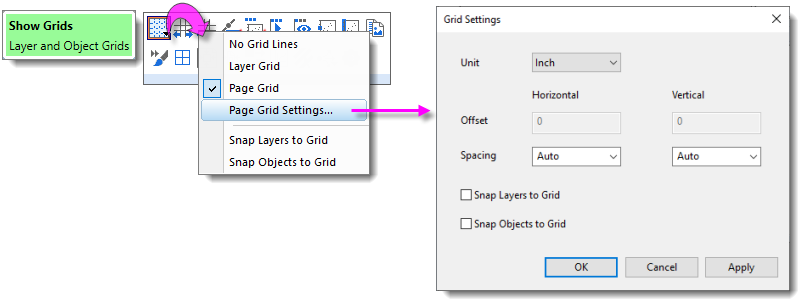
Displaying and customizing the page grid
You can enable and customize a non-printing/non-exporting page grid to assist in placing text and drawing objects on the graph page.
To turn on the page grid:
- Hover inside the graph window, near the top of the page, and when you see the Mini Toolbar prompt
 , click to show the toolbar and click on Show Grids to show the drop-down menu. , click to show the toolbar and click on Show Grids to show the drop-down menu.
or
- From the main menu, choose View: Show: Page Grid.
 | Page grid color can be modified using the color() function and the @GCP system variable. Open the Script Window (Window: Script Window), type the following and press Enter (substituting your RGB values for those in the script).
@GCP=color(R, G, B, 1)
If the grid is already displayed, press F5 to see the change.
|
The Master Page
The Master Page is used to add one or more common objects to exported or printed graphs. Use the master page to add a set of properties and objects -- a custom background, a company logo, text labels, images, etc. -- to all or to selected graph windows in your project.
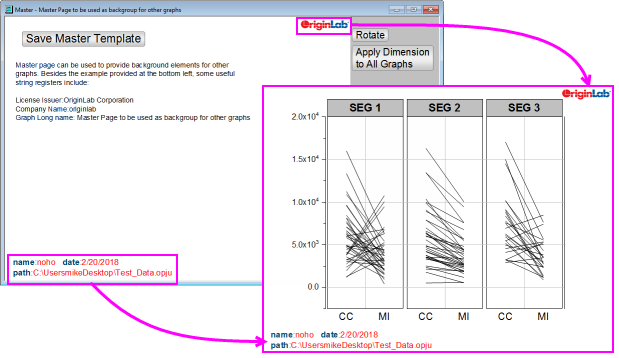
To make use of this feature, you must first create your Master Page. The Master Page should contain only the properties and objects that you want to display on your selected graph windows:
- From the menu, choose File: New: Master Page. If you are not in the project root folder when selecting this menu item, you will be asked to switch to the project root folder.
- Customize the Master Template. Note that the comments that show beneath the Save Master Template button are "hidden" and will not be applied to your graph windows.
- Click the Save Master Template button. When you save, the Master Template will be saved to the User Files Folder as "name of active window".otpu (e.g. "C:\Users\YourName\Documents\OriginLab\User Files\Master.otpu").
For more information on the Master Page, see Creating a Master Page Layout for Graphs.
| This section covers the following topics:
|
|