9.3.5 Editing the Plots Display RangePlotSetup-EditDisplayRange
You can alter the display range of a data plot without masking or otherwise altering the worksheet's display range. This is particularly handy when you have other plots in the project that use the same worksheet data. By altering only the plot display range, you can be sure that you are altering only the plot of interest.
There are three ways to alter the data plot's display range:Plot Setup dialog box, Layer Content dialog box and the context menu of the graph. We begin with the assumption that you have created a graph window with one or more plots and you want to alter the display range of one or more of the plots.
Display Range Setting in Plot Setup
- ALT+Double-click on the layer n icon in the upper left corner of the graph window. This opens the Plot Setup dialog box.
- Use the buttons to open all three panels in this dialog box.
- Highlight the graph window's source worksheet in the top panel.
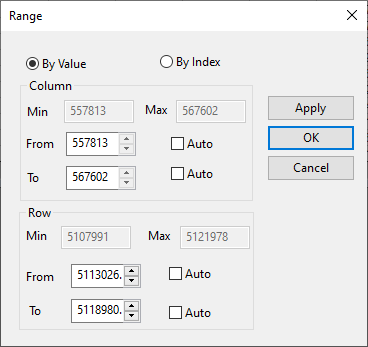
- Click to the right side of the data plot's listed range, under the Range heading in the bottom panel. This produces a button which, when clicked on, opens the Range dialog box.
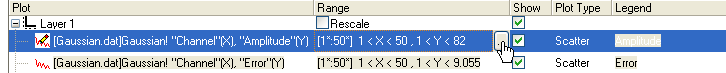
- Clear the Auto check boxes (if selected) and edit the From and To values, as needed.
- Click OK (in the Range dialog box).
- Edit the Range for each plot, as needed.
- If you do not wish to have the graph axes rescaled to accommodate the changes to the plot display, clear the Rescale check box under the Range heading.
- Click OK. The plot is redrawn with new From and To values. If you checked Rescale, the axes are rescaled to reflect the changes to the plot range.
| Notes: After you have customized the range for a plot, you can apply the range to other plots in the same group/layer/page by right-clicking on this plot and then selecting Apply Range to Group/Apply Range to Layer/Apply Range to Page.
|
Display Range Setting in Layer Content
- With the graphs active, right-click on the layer icon in the upper-left corner of the graph window.
- Select Layer Content from main menu.
- Right-click the Layer icon to select Layer Contents from the context menu.
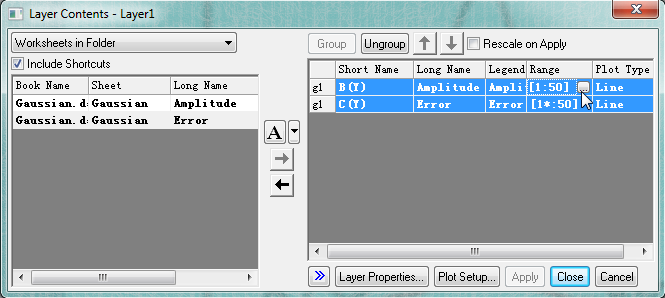
- In the layer content list box of the right panel, go to the Range column and click the button to open the Range dialog box. If the Range is not included, right click on the column header area of this list to view a context menu, and then check the Range .
- The following range setting steps are identical with Step 5 to Step 9 in the Display Range setting in Plot Setup session.
Display Range Setting from Context Menu
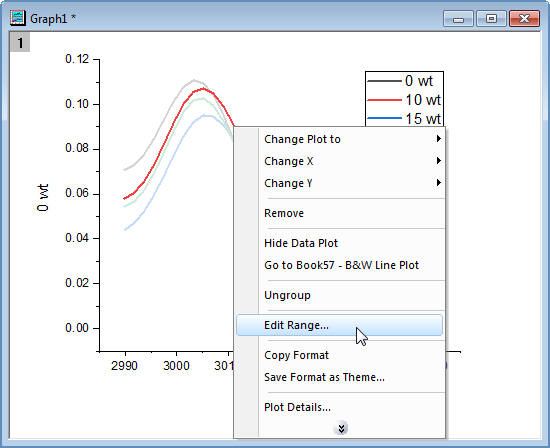
- With the graphs active, click the target plot to select it, then right-click and select Edit Range in the context menu. This opens the Range dialog box.
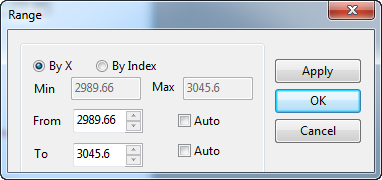
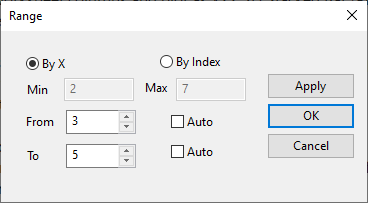
- Click the By X (X must be monotonic) or By Index buttons, clear the Auto box for From and To as needed, then enter values. Click Apply to see the effect of your changes and/or click OK to close the dialog.
 | By default, you edit display range for a single plot in the layer at a time. However, by setting layer.commonrange=1 for the active graph layer prior to editing display range, you can set a common display range for all plots in the layer by editing range for a single plot.
|
Display Range Setting of 3D Graphs
Open the Range dialog box right-clicking on a 3D plot and selecting Edit Range.
- Matrix or virtual matrix data: If monotonic in both X and Y dimensions, the user can edit range By Value. Otherwise, limit editing of range to row index values (By Index).
-
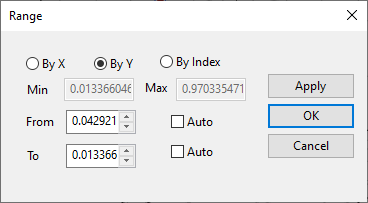
- XYZ data: If monotonic in the X dimension, allow editing range by X values (By X); if monotonic in the Y dimension, allow editing range by Y values (By Y). Otherwise, limit editing of range to row index values (By Index).
-
- XYY data: If monotonic in the X dimension, allow editing range by X values (By X). Otherwise, limit editing of range to row index values (By Index).
-
|