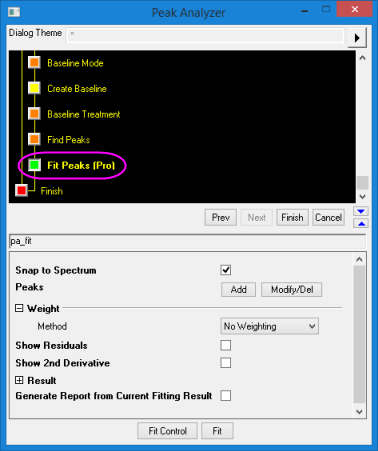
19.1.10.11 Peak Analyzer, Fit Peaks PagePeakAnalyzer-FitPeak
This page is for OriginPro only. It is available in the Peak Analyzer only when Fit Peaks is selected for Goal in the Start page. It performs fitting to the peaks that are found by the Find Peaks page.
- Menu Command: Analysis: Peaks and Baseline: Peak Analyzer: Open Dialog
- Window Types: Workbook, Graph
Dialog Theme
Fit Peaks Controls
| Snap to Spectrum
|
Select this checkbox to specify whether you want the peak center anchor points to be snapped to the spectrum data. If this is selected, the peak center anchor points will be pulled onto the spectrum as you add or move them.
|
| Peaks
|
Click the Add button to add peaks manually. Or, click the Modify/Del button to modify or delete peaks manually.
|
| Show Residuals
|
Specifies whether to show the current residuals plot.
|
| Show 2nd Derivative
|
Specifies whether to show the second derivative of the spectrum data.
|
| Generate Report from Current Fitting Result
|
If this check box is selected, the results report will be generated after you click the Finish button even when the fitting does not converge. Otherwise, the results report will be generated only when the fitting converges.
|
| Fit Control
|
Click this button open the Peak Fit Parameters dialog, which allows you to control the fitting. See more details here.
|
| Fit
|
Click this button to perform the fit.
|
The Weight Group
| Method
|
Specifies the weighting method, which will be used in the calculating the Chi-Square during the fitting. The available weighting methods are:
- No Weighting
- Instrumental
- Statistical
- Arbitrary Dataset
- Direct Weighting
See details in Fitting with Errors and Weighting
|
| Data
|
This is available when Method is Instrumental, Arbitrary Dataset or Direct Weighting. Use this to specify the dataset that will be used for weighting.
|
The Result Group
The Output Settings Branch
| Dataset Identifier
|
Specify the identifier for the source datasets.
- Identifier
- Select a type to specify the source datasets information. The Identifier can be Range, Book Name, Sheet Name, Name (Use the long name of the corresponding column if there is a long name, otherwise use the short name of column.), Short Name, Long Name, Units, Comments, <Custom> (For its usage, please refer to Advanced legend text customizations).
- Show Identifier in Flat Sheet
- Specify whether to use the dataset identifier in flat sheet.
|
| Report Tables/ Peaks Table/ Fitted Curves
|
Specifies the destination of Report Tables/ Peaks Table/ Fitted Curves. Report Tables store comprehensive results for peak fitting. Peaks Table store peaks information. Fitted Curves store the data for baseline and fitted curves.
- Book
- <none>: Do not output Report Tables/ Peaks Table/ Fitted Curves
- <auto>: If source workbook is available, the source workbook will be used as output; Otherwise, a new workbook will be created and used as output.
- <source>: The workbook that has the source data.
- <new>: A new workbook.
- <existing>: A specified existing workbook.
- BookName
- Sheet: the destination worksheet. This is always <new>.
- SheetName
- Results Log (Report Tables only): Output the report to the Results Log.
- Script Window (Report Tables only): Output the report to the Script Window.
- Notes Window (Report Tables only): Use this drop-down list to specify the destination Notes Window.
- <none> (Report Tables only): Do not output to any Notes window.
- <new> (Report Tables only): Output to a new Notes window.
|
| Fit Residuals
|
Specifies the destination workbook and worksheet for residual values
- Book
- <fittedvalue>: The workbook where the fitted values will be output.
- <new>: A new workbook.
- <existing>: A specified existing workbook.
- BookName
- Sheet
- <fittedvalue>: The worksheet that has the fitted values.
- <new>: A new worksheet.
- <existing>: A specified existing worksheet.
- SheetName
|
| Subtracted Data
|
This is available only when a baseline has been subtracted and the Add Back Baseline check box is disabled. Specifies the destination workbook and worksheet for subtracted data.
- Book
- <fittedvalue>: The workbook where the fitted values will be output.
- <new>: A new workbook.
- <existing>: A specified existing workbook.
- BookName
- Sheet
- <new>: The worksheet that has the fitted values.
- <existing>: A specified existing workbook.
- SheetName
|
| Baseline Data
|
This is available only when a baseline has been subtracted and the Add Back Baseline check box is enabled. Specifies the destination workbook and worksheet for baseline data.
- Book
- <fittedvalue>: The workbook where the fitted values will be output.
- <new>: A new workbook.
- <existing>: An existing workbook.
- BookName
- Sheet
- <new>: The worksheet that has the fitted values.
- <existing>: A specified existing workbook.
- SheetName
|
The Configure Report Branch
| Quantities to Compute
|
Specifies the quantities to be computed and displayed in the fitting report.
- Fit Parameters
- Value: Parameter value.
- Shared: If the parameter is not shared, this will be 0. Otherwise, this value indicates the index of the peak whose corresponding parameter is shared with the parameter.
- Fixed: Specifies whether the parameter is fixed.
- Standard Error: Standard error of parameters
- LCL: The lower confidence limit
- UCL: The upper confidence limit
- Confidence level for Parameters (%): The confidence level for regression
- t-Value: t-test value of parameters
- prob>|t|: p-value of parameters
- Dependency: The dependency values for parameters
- CI Half-Width: Half-width of the confidence interval
- Lower Bound: Lower bound
- Upper Bound: Upper bound
- Fit Statistics
- Number of Points: Total number of fitting points
- Degrees of Freedom: Model degrees of freedom
- Reduced Chi-Sqr: The reduced Chi-Square value
- R Value: The R value, equals to square root of

- Residual Sum of Squares: Residual sum of squares (RSS); or sum of square error.
- R-Square (COD): Coefficient of determination
- Adj. R-Square: Adjusted coefficient of determination
- Root-MSE (SD): Residual standard deviation; or square root of mean square error.
- Number of Iterations: Number of iterations that were performed.
- Fit Status: The status of the fitting
- ANOVA: Output the analysis of variance table.
- Covariance matrix: Output the covariance matrix.
- Correlation matrix: Output the correlation matrix.
Please see details on the computation here.
|
| Peaks Properties
|
Specifies the peak characteristics to be computed and displayed in the peak worksheet report.
- Peak Index: The indices of peaks.
- Peak Function Type: The function that was used to fit the peak. (In the report worksheet, this column is named Peak Type.)
- Fitted Peak Area: Integrate to find the area between the peak function and the baseline using the parameter values obtained from the fit. The integration is performed from
 to to  . (In the report worksheet, this column is named Area Fit.) . (In the report worksheet, this column is named Area Fit.)
- Fitted Peak Area Contained in Fitting Range: Integrate to find the area between the peak function and the baseline using the parameter values obtained from the fit. (In the report worksheet, this column is named Area FitT.)
- Fitted Peak Area Contained in Fitting Range(%): Integrate to find the area between the peak function and the baseline using the parameter values obtained from the fit. The integration is performed within the data range only. The result is expressed as a percent of the total area. (In the report worksheet, this column is named Area FitTP.)
- Peak Area by Integrating Data: Integrate to find the area between the fitted peak data and the baseline. The fitted peak data corresponds to Fit Peak # (Long Name) in FitPeakCurve# output sheet. The integration is performed within the data range only. (In the report worksheet, this column is named Area Intg.)
- Peak Area by Integrating Data(%): Integrate to find the area between the fitted peak data and the baseline. The fitted peak data corresponds to Fit Peak # (Long Name) in FitPeakCurve# output sheet. The integration is performed within the data range only. The result is expressed as a percent of the total area. (In the report worksheet, this column is named Area IntgP.)
- Location for Peak Maximum Height: The X value for the peak maximum. (In the report worksheet, this column is named Center Max.)
- Peak Gravity Center: The X value of the peak center of gravity (
 ). See 3rd Order Moment below. (In the report worksheet, this column is named Center Grvty.) ). See 3rd Order Moment below. (In the report worksheet, this column is named Center Grvty.)
- Peak Maximum Height: The Y value for the peak maximum. (In the report worksheet, this column is named Max Height.)
- Full Width @ Half Maximum: The peak width at half the peak's maximum value (In the report worksheet, this column is named FWHM).
- Width At: Specifies whether to enable the Width At(% of peak maximum) text box below.
- Width At(% of peak maximum): The peak width at n% of the peak's maximum value, where n is the value entered in this text box. (In the report worksheet, this column is named WidthAtP.)
- Area above: Specifies whether to enable the Area above(% of peak maximum) text box below.
- Area above(% of peak maximum): The peak area above the n% of the peak's maximum value, where n is the value entered in this text box (In the report worksheet, this column is named AreaAbove).
- Cumulative Area to: Specifies whether to enable the Cumulative Area to(Relative to center) text box below.
- Cumulative Area to(Relative to center): The cumulative fitted area from to X, where X is the value entered in this text box and will be viewed as a specified value relative to the peak center (In the report worksheet, this column is named CumArea).
- Peak Variance: variance of the function, which is the second moment (
 ). See 3rd Order Moment below (In the report worksheet, this column is named Variance). ). See 3rd Order Moment below (In the report worksheet, this column is named Variance).
- Peak Skew: Fisher skewness, which is a measure of the degree of asymmetry of the peak.
 - where
 is the 3rd order moment and is the 2nd order moment. See their computations below. is the 3rd order moment and is the 2nd order moment. See their computations below.
- (In the report worksheet, this column is named Skew.)
- Peak Excess: Fisher kurtosis, measures the long-tailedness or peakedness of the peak relative to the normal or Gaussian distribution with the same mean and variance.
 - where
 is the 4th order moment and is the 2nd order moment. See their computations below. is the 4th order moment and is the 2nd order moment. See their computations below.
- (In the report worksheet, this column is named Excess.)
- Resolution with Next Adjacent Peak.
}") - where
 and and  are peak centers, and are peak centers, and  and and  are constructed base widths. are constructed base widths.
- (In the report worksheet, this column is named Resolution.)
- 3rd Order Moment:
- The moments are defined as follows:
dx") (0th moment or the area of the peak) (0th moment or the area of the peak)
x^ndx") , where , where  (nth zero-point moment) (nth zero-point moment)
(x-m_1')^ndx") , where , where  ((nth central moment) ((nth central moment)- (In the report worksheet, this column is named Moment3.)
- 4th Order Moment:
- The fourth order moment. See 3rd Order Moment above. (In the report worksheet, this column is named Moment4.)
- Moments Computation Methods:
- This is available only when a least one of the following check boxes are selected: Peak Skew, Peak Excess, Resolution with Next Adjacent Peak, 3rd Order Moment and 4th Order Moment. You can use this drop-down list to select the method to calculate the peak properties related to moments. Two options are available:
- Speed Mode (Numeric Integral): Use trapezoid rule to perform integration on datasets when computing the moments.
- Accurate Mode (Function Integral): Use the function definition to compute the moments. This is more accurate than the speed mode.
- Note: for a peak which you fit with GaussAmp, Gaussian, Lorentz or BiGaussian, the selection in this drop-down list will not apply. Instead, Origin used the fitted parameters to calculate the moments.
- Y Maximum:
- Output the Y maximum (with baseline) for each found peak.
|
The Configure Graph Branch
| Create Summary Graph
|
Specifies whether to create report graph.
- None: Do not to create report graph.
- New Graph: Create a new report graph.
- Source Graph: Only available when source data is from graph. Use source graph as report graph.
|
| Result Table
|
It is available only when Create Summary Graph was selected to New Graph or Source Graph. Use this drop-down list to specify whether to show the result table on the report/summary graph.
-
- No not add fitting result table to the graph.
- Add fitting result table to the summary graph.
- Add fitting result table to the embedded graphs in the report sheet.
- Summary and Report Graphs
- Add fitting result table to both the summary graph and report sheet graph.
- Table Style Template: Specifies the table template (*.OTW) to be used to show the results on the graph. By default, the system template is used. The table template should be placed in Origin installation folder for it to be used directly by name, e.g., MyTable.otw.
- Quantities in Table: Specify the quantities to be shown on table by inputting it in format *Quantity Abbreviation. You can also click the more options button next to edit box to bring up Quantities in Table dialog and add/remove/order the quantities.
|
| Fitted Curves Plot
|
When this checkbox is selected, fitted curves will be outputted and the controls under this branch will become available. Otherwise, the fitted curves will not be outputted and other controls will be unavailable.
- Plot Curves: Use this drop-down list to select the curves to be plotted.
- Individual Peak curve: A curve for each individual peak
- Cumulative Curve: Cumulative curve for all peaks
- Both: Both individual peak curve and cumulative curve will be plotted.
- Use Separate X Data for Individual Peak: Use separate X data for individual peak so every fitted peak has its individual X data column. If unchecked, all peaks will share a same X data column.
- X Data Points for Individual Peak: Only available when Use Separate X Data for Individual Peak checkbox is checked. Specify the number of data points for X column for each peak.
- Add back Baseline: Specifies whether to add the baseline to the fitted curves and spectrum curve, if the baseline has been subtracted from the source data.
- Plot in Report Table: Specifies whether to include the plots in the report table.
- Stack with Residual vs. Independents Plot: Stack the fitted curve with the Residual vs. Independents Plot.
- Update Legend on Source Graph: Specifies whether to auto update legend on the source graph. Available only when Create Summary Graph is set to <Source Graph>.
- X Data Type: Specifies how to generate the X values of the fitted curve:
- Uniform Linear: The X values of the fitted curve are plotted on an evenly-spaced linear scale.
- Log: The X values of the fitted curve are plotted on a logarithmic scale.
- Same as Input Data: The X values of the fitted curve are the same as the input X values.
- Use Source Graph Scale Type: The X values of the fitted curve uses the same scale type of the source curve. (The option for the source X scale is linear curve.)
- Follow Curve Shape: The X values of the fitted curve are smartly computed so that the fitted curve will follow the source curve shape. It is very useful when the shape of the source curve changes rapidly in some areas. For example, multiple peaks center in a short X range. (This option for the source X scale is not linear curve, for example, the X scale is set to Log10.)
- Points
- This control is available only when X Data Type is either Uniform Linear or Log. It specifies the total number of data points in a fitted curve.
- Range
- This control is available only when X Data Type is either Uniform Linear or Log. It specifies the range of the X values of the fitted curve. Select one of the following options:
- Use Input Data Range + Range Margin: Use the X range of the input data and range margin specified in the Range Margin (%) text box below.
- Span to Full Axis Range: Span the X values to the full axis range.
- Custom: Enter the minimum X value and maximum X value in the Min and Max edit boxes below.
- Range Margin (%): This control is available only when X Data Type is either Uniform Linear or Log and Use Input Data Range + Range Margin is selected for Range. It specifies the range margin into which the fitted curves extend.
- Min: This text box is available only when X Data Type is either Uniform Linear or Log and Custom is selected for Range. It specifies the minimum X value for the fitted curves.
- Max: This text box is available only when X Data Type is either Uniform Linear or Log and Custom is selected for Range. It specifies the maximum X value for the fitted curves.
- Confidence Bands: If this is checked, confidence bands will be added to the fitted curve plot as two lines with filled area in between. You can turn the area fill off or customize the fill pattern on the Line tab of Plot Details dialog.
- Prediction Bands: If this is checked, prediction bands will be added to the fitted curve plot as two lines with filled area in between. You can turn the area fill off or customize the fill pattern on the Line tab of Plot Details dialog.
- Confidence Level for Curves(%): Specify the confidence level for confidence bands and prediction bands. This is editable when either the Confidence Bands check box or the Prediction Bands check box is selected.
|
| Residual vs. Independent Plot
|
Specifies whether to output the Residual vs. Independent plot.
|
| Peak Report Fields
|
This Peak Report Fields group includes a display box and a toolbar with five buttons  : :
- Triangle Button for Select
 . Click this button then choose a peak property from fly-out menu: . Click this button then choose a peak property from fly-out menu:
- Peak Index: The index of the peak. (In the graph report, this column is named Peak Index.
- Peak Function Type: The function that was used to fit the peak. (In the graph report, this column is named Peak Type.)
- Fitted Peak Area: Integrate to find the area between the peak function and the baseline using the parameter values obtained from the fit. The integration is performed from to (In the graph report, this column is named Area Fit).
- Fitted Peak Area Contained in Fitting Range: Integrate to find the area between the peak function and the baseline using the parameter values obtained from the fit (In the graph report, this column is named Area FitT).
- Fitted Peak Area Contained in Fitting Range(%): Integrate to find the area between the peak function and the baseline using the parameter values obtained from the fit. The integration is performed within the data range only. The result is expressed as a percent of the total area. (In the graph report, this column is named Area FitTP.)
- Peak Area by Integrating Data: Integrate to find the area between the peak data and the baseline. The integration is performed within the data range only (In the graph report, this column is named Area Intg).
- Peak Area by Integrating Data(%): Integrate to find the area between the peak data and the baseline. The integration is performed within the data range only. The result is expressed as a percent of the total area (In the graph report, this column is named Area IntgP).
- Location for Peak Maximum Height: The X value for the peak maximum (In the graph report, this column is named Center Max).
- Peak Gravity Center: The X value of the peak center of gravity (). See 3rd Order Moment below (In the graph report, this column is named Center Gravity).
- Peak Maximum Height: The Y value for the peak maximum (In the graph report, this column is named Max Height).
- Full Width @ Half Maximum: The peak width at half the peak's maximum value. (In the graph report, this column is named FWHM).
- Resolution with Next Adjacent Peak
- where and are peak centers, and and are constructed base widths.
- (In the graph report, this column is named Resolution.)
- Width At: The peak area above the n% of the peak's maximum value, where n is specified by the Width At(% of Peak Maximum) text box in the Peaks branch of the Configure Report group. (In the graph report, this column is named WidthAtP.)
- Area above: The peak area above the n% of the peak's maximum value, where n is specified by the Area above(% of peak maximum) text box in the Peaks branch of the Configure Report group. (In the graph report, this column is named AreaAbove.)
- Cumulative Area to: The cumulative fitted area from to X, where X is the value in the Cumulative Area to(Relative to center) text box in the Peaks branch of the Configure Report group and will be viewed as a specified value relative to the peak center. (In the graph report, this column is named CumArea.)
- Peak Variance: Variance of the function, which is the second moment (). See 3rd Order Moment below. (In the graph report, this column is named Variance.)
- Peak Skew: Fisher skewness, which is a measure of the degree of asymmetry of the peak.
- where is the 3rd order moment and is the 2nd order moment. See their computations below.
- (In the graph report, this column is named Skew.)
- Peak Excess: Fisher kurtosis, measures the long-tailedness or peakedness of the peak relative to the normal or Gaussian distribution with the same mean and variance.
- where is the 4th order moment and is the 2nd order moment. See their computations below.
- (In the graph report, this column is named Excess.)
- 3rd Order Moment:
- The moments are defined as follows:
dx") (0th moment or the area of the peak) (0th moment or the area of the peak)
x^ndx") , where (nth zero-point moment) , where (nth zero-point moment)
(x-m_1')^ndx") , where ((nth central moment) , where ((nth central moment)- (In the graph report, this column is named Moment3).
- 4th Order Moment: The fourth order moment. See 3rd Order Moment above. (In the graph report, this column is named Moment4.)
- Add All: Add all quantities to Peak Report Fields edit box.
- Reset: Reset quantities in Peak Report Fields edit box.
- Remove button

- Remove the selected peak properties from the Display Box. This button is available when you select one or more selected peak properties in the box.
- Move Up button

- Move the selected peak properties up in the Display Box. Use this button to order the peak properties and the results table will follow this order.
- Move Down button

- Move the selected peak properties down in the Display Box. Use this button to order the peak properties and the results table will follow this order.
- Select All button

- Select all data peak properties down in the Display Box. When clicked, this button becomes Unselect All button
 . .
|
Quantities in Table Dialog Control
Only available when Show Result Table on Graph is checked under Result: Configure Graph node. This Quantities in Table dialog includes a display box and a toolbar with five buttons :
|