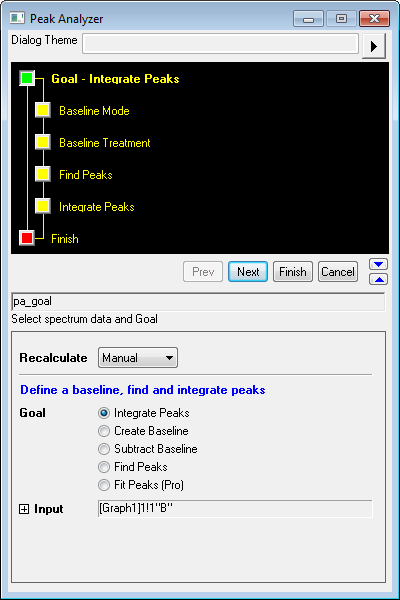
19.1.1 Peak Analyzer:Quick StartPeakAnalyzer-QS
The Peak Analyzer is a goal oriented peak analysis wizard. The major goals are as following:
Baseline Detection
Select Create Baseline as Goal if you simply want to create a baseline. Baseline creation is a necessary step in goals Integrate Peaks, Find Peaks, Fit Peaks(Pro).
There are generally two ways to create a baseline:
 | Click here if what you want is a step by step tutorial about how to create and subtract baseline.
|
Automatically Find and Treat Baseline
In Origin, baseline auto detection usually involves three steps below:
Auto Find Anchor Points for a Baseline
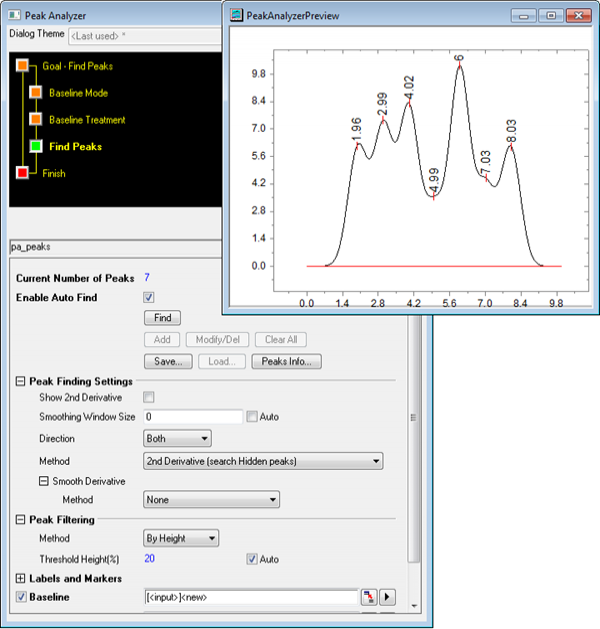
Select User Defined as Baseline Mode and click Find button on the bottom to auto detect anchor points.
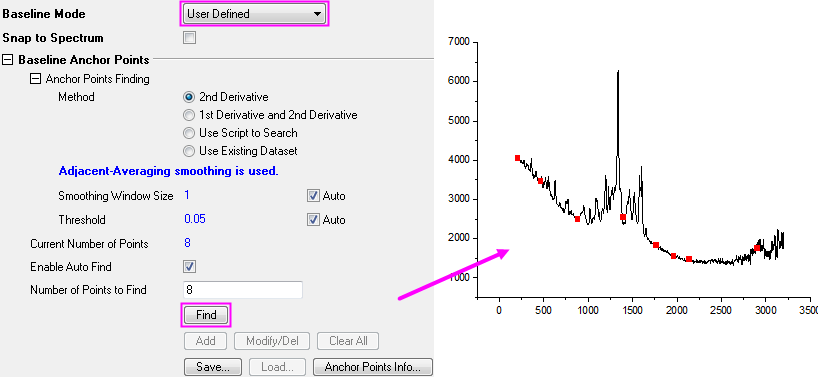
| - Select 1st Derivative and 2nd Derivative when baseline is approximately constant.
- Increase Smoothing Window Size value if further smoothing is needed for the result baseline.
- Increase Threshold if you want to detect more anchor points.
|
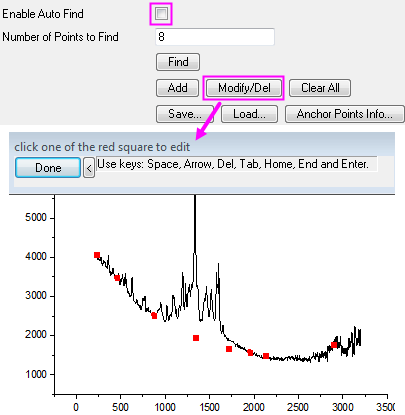
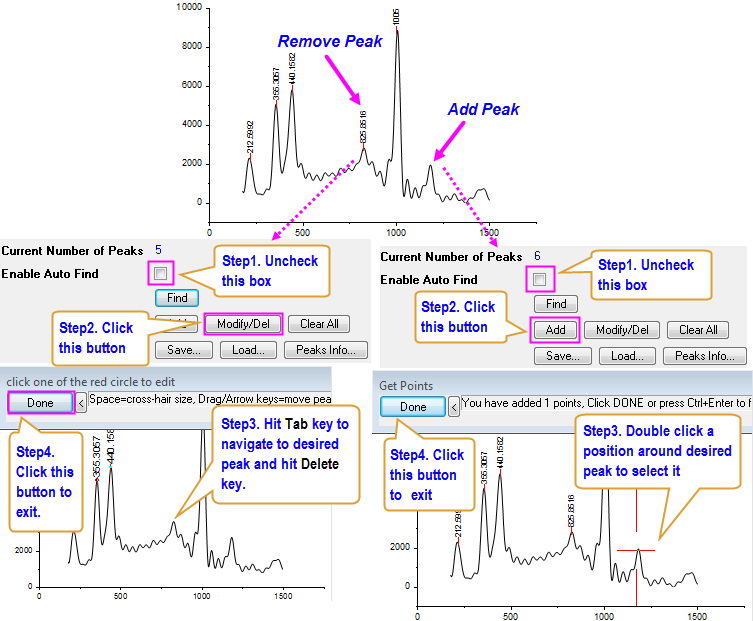
Modify Detected Anchor Points
1. Uncheck Enable Auto Find checkbox and click Modify/Del button to enter anchor points editing mode.
2. Use mouse cursor to select or Tab, Home, End keys to navigate to desired points.
3. While the point is highlighted, keep mouse click pressed to drag or use four Arrow keys to move it stepwise.
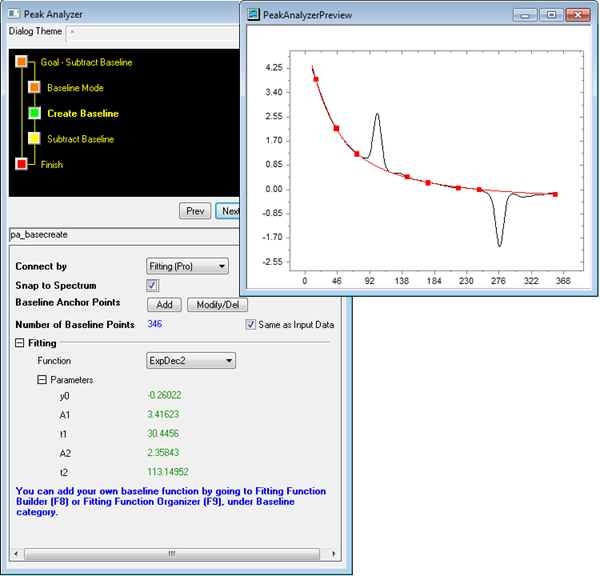
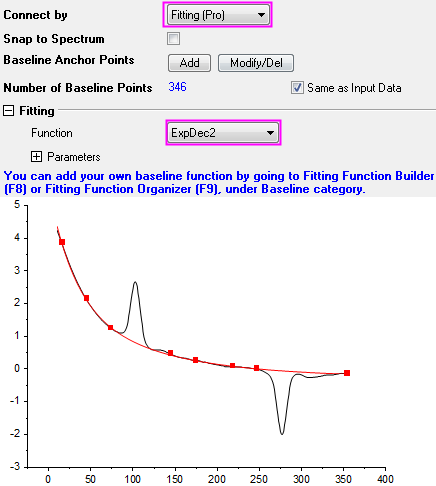
Fit a Baseline
1. Select Fitting(Pro) as anchor points connection method.
2. Select a fitting function from Function drop-down list to fit.
Create a Baseline
Commonly Used Baseline Types
Origin also provides commonly used baseline types as listed in table below:
| Baseline Type
|
Descriptions
|
Examples
|
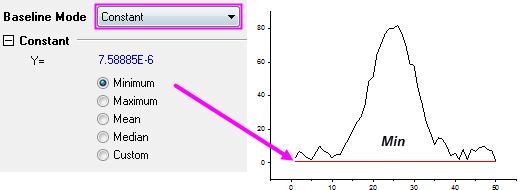
| Constant
|
Use one of the statistical values or a given value as constant baseline.
|
|
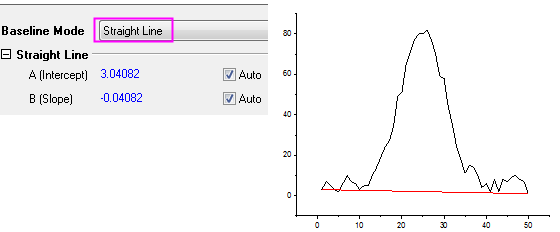
| Straight Line
|
Create a straight line as baseline by setting the Y intercept and slope. The default value of A(Intercept) and B(Slope) is obtained by connecting the two end points of the data.
|
|
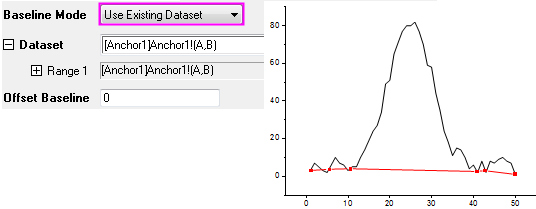
| Use Existing Dataset
|
Use existing dataset as baseline.
|
|
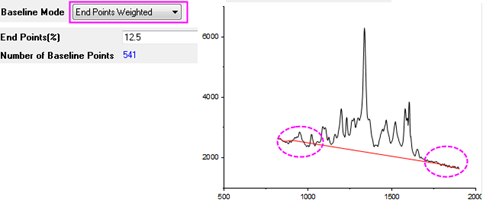
| End Points Weighted
|
Create a baseline by weighting certain fraction of the end points.
|
:
|
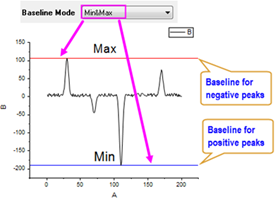
| Min&Max
|
Positive peaks will use Minimum value as baseline while negative peaks use Maximum. Only available when Goal is Find Peaks.
|
|
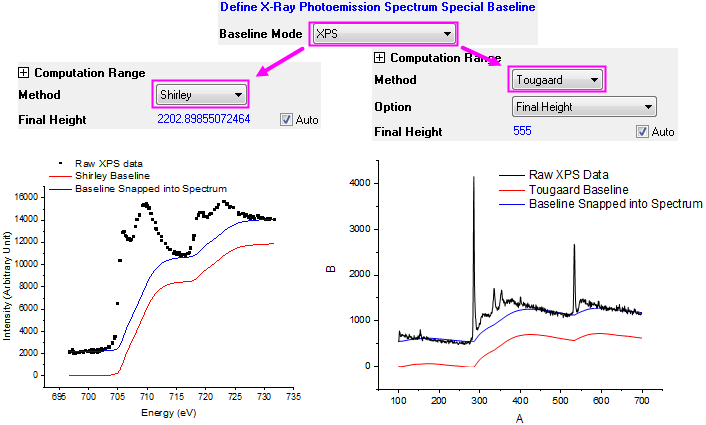
Baseline for X-ray Photoemission Spectroscopy (XPS)
Create baseline for XPS using Shirley or Tougaard method and adjust corresponding parameters to optimize.
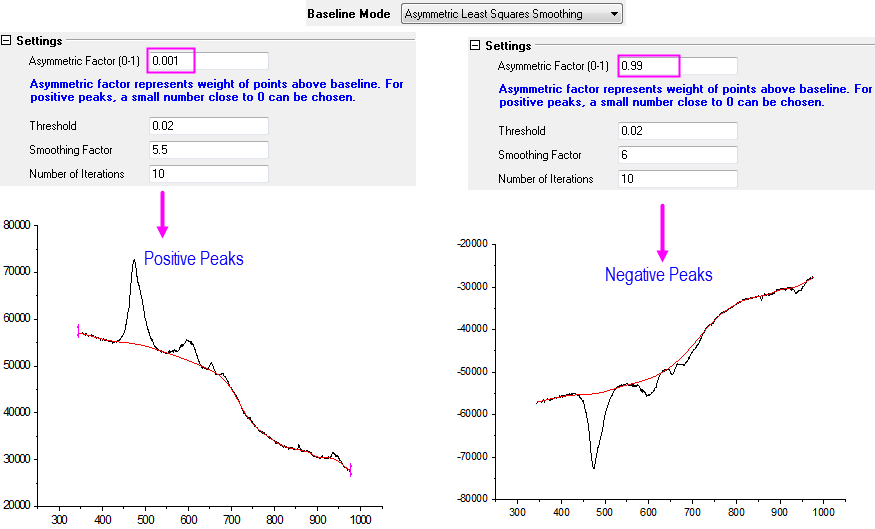
Baseline Detected by Asymmetric Least Squares Smoothing Method
Create baseline using Asymmetric Least Squares (ALS) Smoothing method and adjust corresponding parameters to optimize. The asymmetric factor should be chosen close to 0 for positive peaks, eg., 0.001, and close to 1 for negative peaks, eg.,0.99.
Peak Finding
In Origin, peak finding generally involves three steps possibly one more below:
| Click here if you want to know a step by step example about finding and marking peaks right away.
|
Find Ordinary Peaks
Select one of the three peak finding methods listed below and click Find button to auto detect ordinary peaks.
| Peak Finding Method
|
Descriptions
|
Example
|
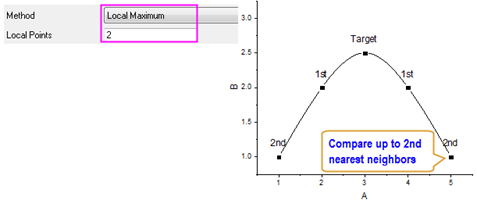
| Local Maximum
|
Compare nearest N neighbors and find the maximum.
|
|
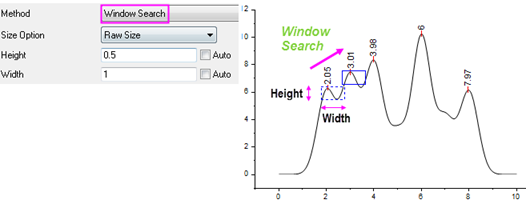
| Window Search
|
Find the maximum value in given search window. Window can be defined in absolute values or percentage value with respect to total width and maximum height.
|
|
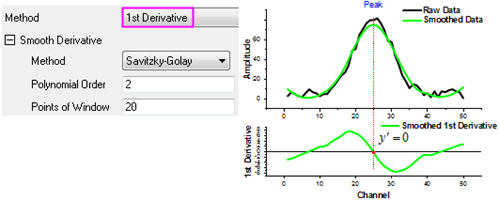
| First Derivative
|
Find where first derivative is equal to 0. Offer options to smooth original data before calculating 1st derivative so as to accurately find peak position(s).
|
|
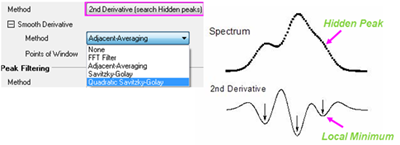
Find Hidden Peaks
Select one from two methods listed below and click Find button to auto detect hidden peaks.
| Peak Finding Method
|
Descriptions
|
Example
|
| Second Derivative
|
Find hidden peaks by detecting local extrema in second derivative of raw/smoothed data.
|
|
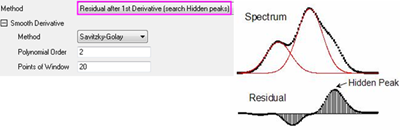
| Residual after 1st Derivative
|
Calculate the residuals between spectrum data and cumulated fitting data and find hidden peaks by detecting residuals greater than certain threshold.
|
|
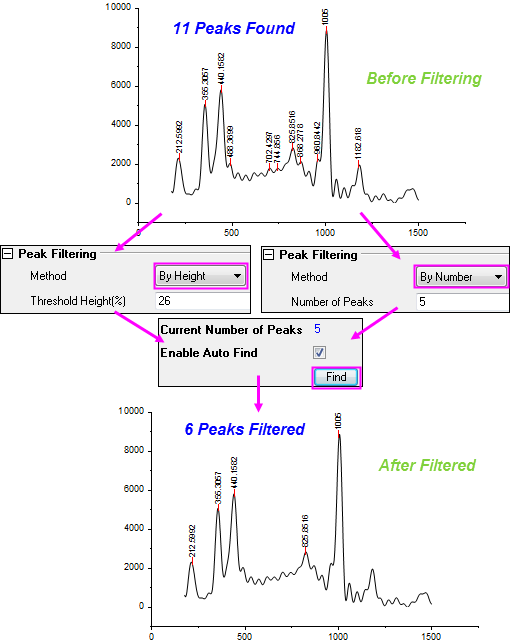
Filter Unwanted Peaks
You can filter the found peaks by number of peaks or by height of the peaks.
- By Height% or By Height Value -- Filter out the peaks with peak height, smaller than threshold specified in Threshold Height(%) text box or Threshold Height text box.
- By Number -- Limit number of peaks to be found.
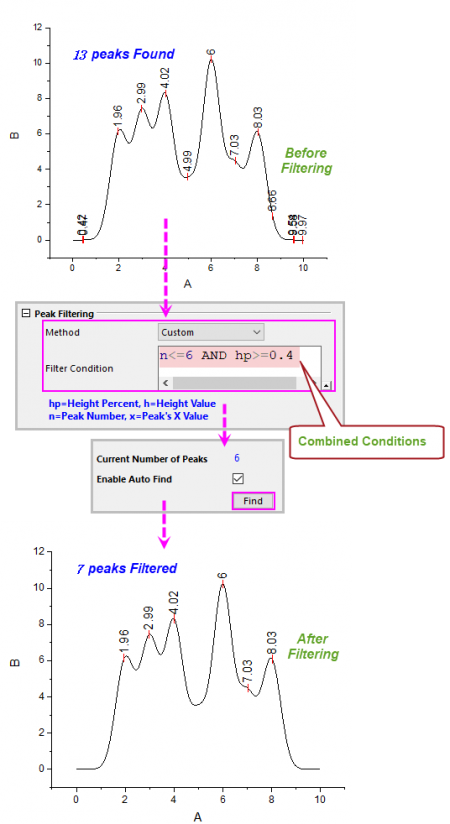
- Custom Condition -- Combine more than one conditions to filter the peaks. Four predefined keywords are available here, hp=Height Percent, h=Height Value, n=Peak Number and x=Peak's X Value.
Add or Remove Peaks
After the peaks being filtered, you can further modify, delete, add peaks. To fine tune the positions of manually added peaks, you have fit the peaks.
Peak Integration
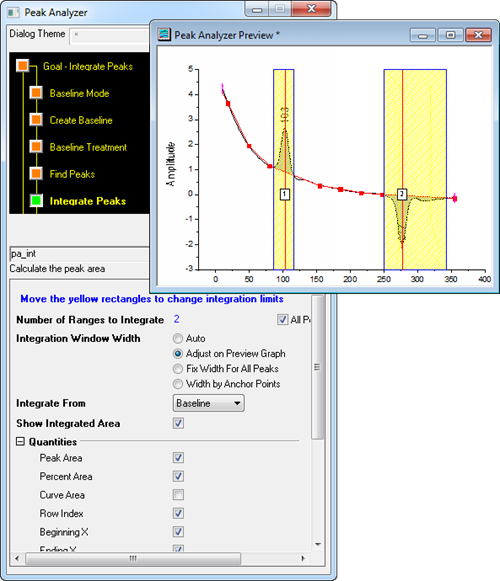
Select Integrate Peaks as Goal to start. Before actually perform peak integration, you have to go through two steps below:
When all the peaks are detected, you only need to set the integration width. Available options are as following:
| Click here if you want to jump into a step by step tutorial about peak integration.
|
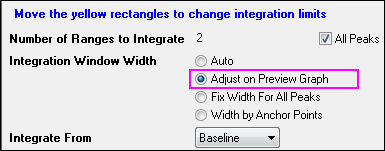
Individually Set Width for Each Peak
Check Adjust on Preview Graph radio box to enable direct adjustment on graph.
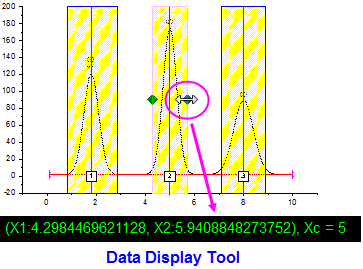
Manually Adjust Integration Width
1. Click on the yellow rectangle to select desired peak.
2. Place mouse cursor on the edge of rectangle and when it turns drag to adjust width arbitrarily or according to coordinates displayed in Data Display Tool on the bottom.
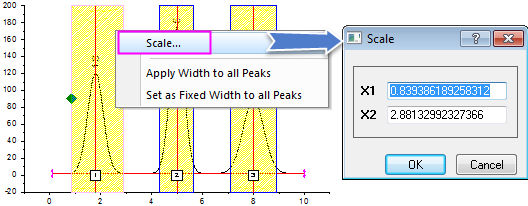
Set Integration Range by Scale
1. Right click on the yellow rectangle of desire peak to select Scale....
2. Enter value in X1, X2 edit boxes in appeared Scale dialog to specify integration range.
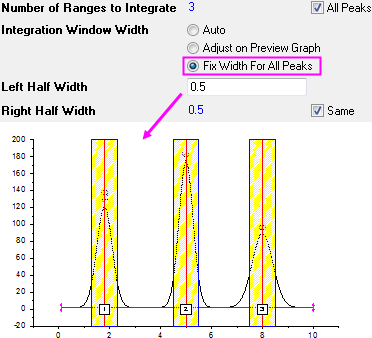
Set Fixed Width for All Peaks
Directly Set a Fixed Width for All Peaks
1. Check Fix Width For All Peaks radio box.
2. Enter left half and right half widths relative to peak center in Left/Right Half Width text box respectively.
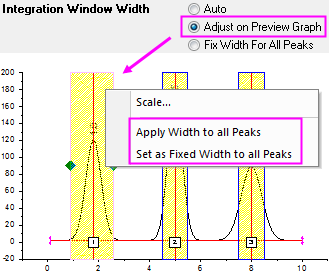
Adjust One Peak Width and Apply to Other Peaks
1. Check Adjust on Preview Graph radio box and adjust width of one peak.
2. Right click on the yellow rectangle around that peak and select either Apply Width to All Peaks or Set as Fixed Width to All Peaks.
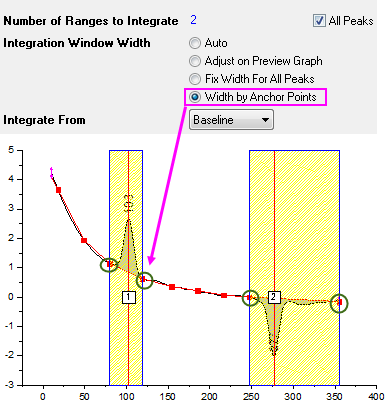
Set Peak Width by Anchor Points
If you selected User Defined for Baseline Mode on Baseline Mode page to use the anchor points to create baseline, you are allowed to select Width by Anchor Points to use the existing adjacent anchor points to determine the width of the peaks.
Peak Fitting
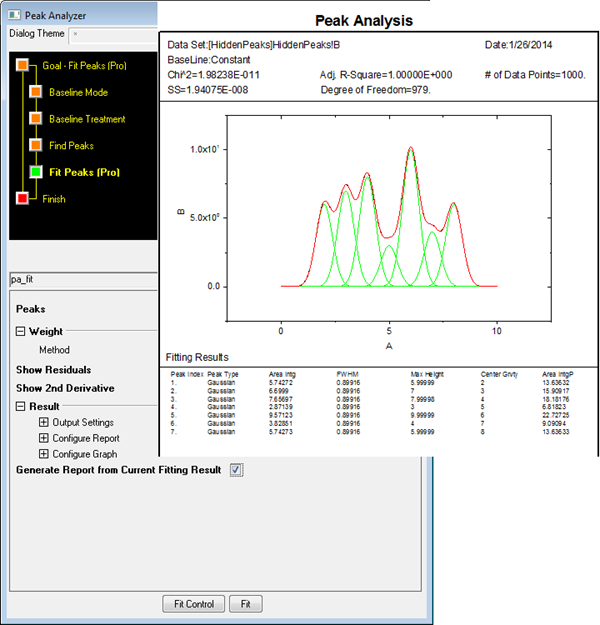
Select Fit Peaks(Pro) as Goal to start. Before actually proceed to fit peaks, you have to go through two steps below:
Fitting Peaks with Built-in or User Defined Functions
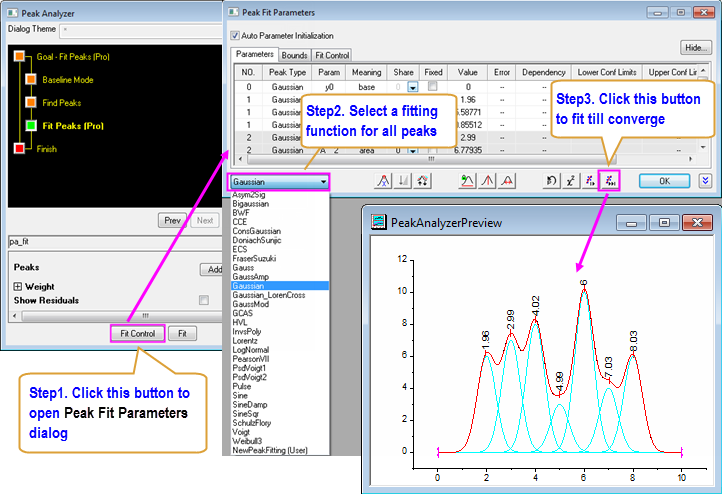
Fitting Peaks with Built-in Function
You can navigate and select a built-in function from one of the peak function categories, and directly fit your curve with automatically initialized parameter values.
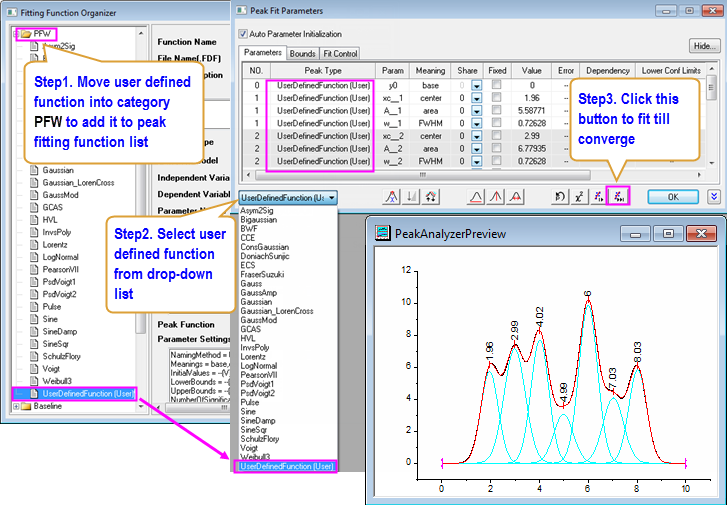
Fitting Peaks with User Defined Function
You can also defined your own peak fitting function to be used in Peak Analyzer.
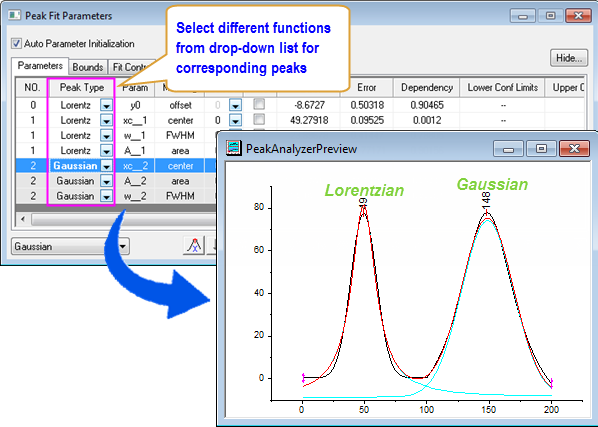
Fit Different Datasets with Different Fitting Functions
You can fit all peaks with same fitting function or different fitting functions.
Fitting Peaks with Baseline
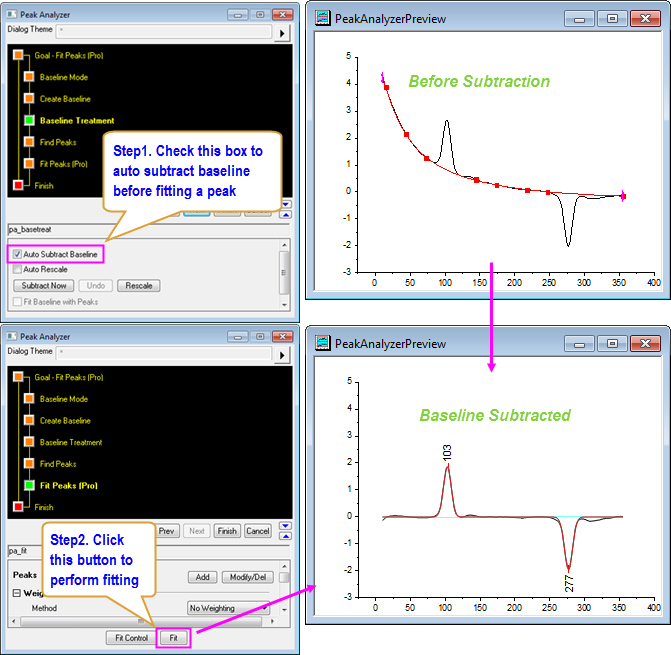
Fitting Peaks with Baseline Subtracted
Fitting Baseline with Peaks
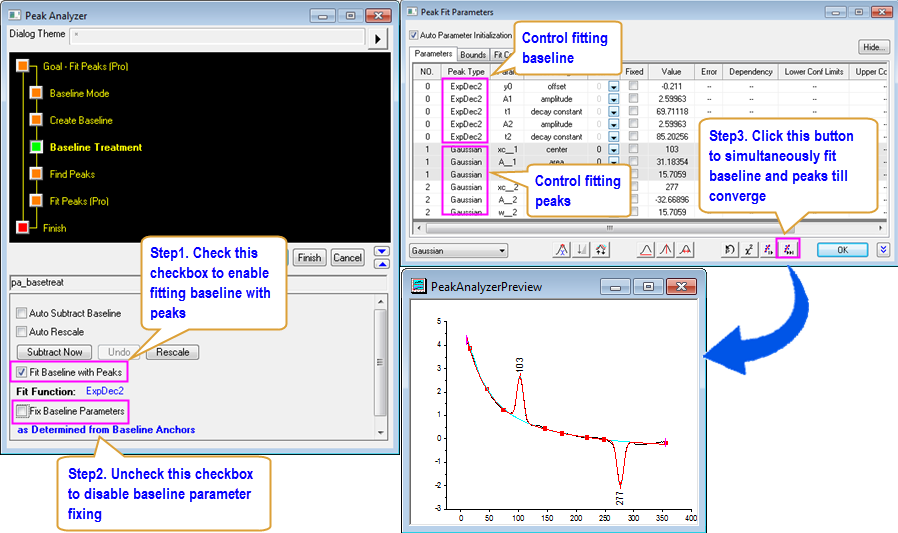
| Read this tutorial to learn how to perform peak fitting while fitting baseline simultaneously.
|
Controlling Fitting Parameters
You can choose to fix or share some parameters and set upper and lower bounds or linear constraints.
Fix or Share Parameters
- Click Fit Control button to open Peak Fit Parameters dialog.
- Select same group number from Share drop-down list to share parameters.
- Check the checkbox in Fixed column to fix certain paramters.
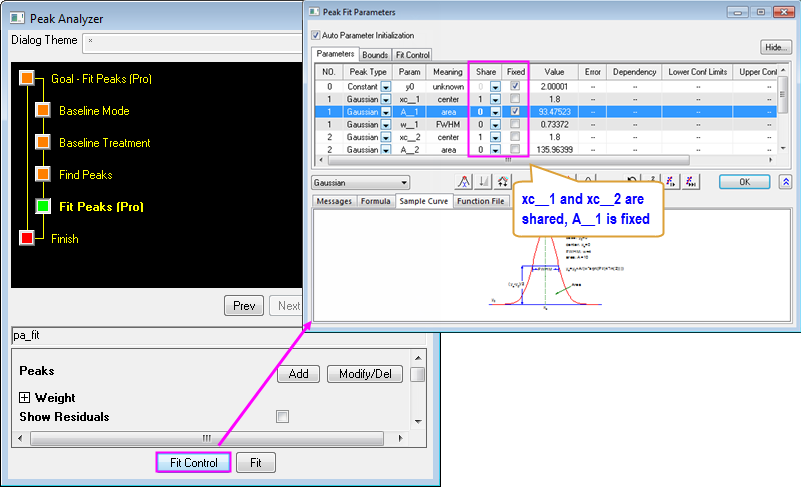
| Read this tutorial to learn how to fix certain parameters and save settings for re-usage.
|
Set Upper and Lower Bounds
- Click Fit Control button to open Peak Fit Parameters dialog and go to Bounds tab.
- Click in desired cell in < or <= column to select operator and enter values in Lower Bounds or Upper Bounds accordingly.
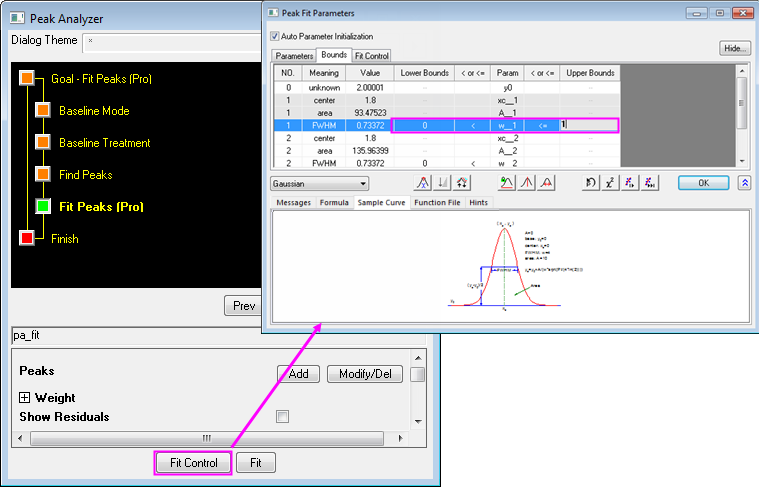
| Read this tutorial to learn how to share status of multiple peak parameters simultaneously.
|
Note: If you have set the Peak Direction to Negative or Positive either, under the Peak Finding Settings branch in the Find Peaks page, Origin will check the bound setting of Amplitude parameter(or Area parameter) of the found peaks before perform peak fitting, and behaviors as below:
- For negative peaks, set upper bound of Amplitude parameter(or Area parameter) to <0 if no bound has been set or the bound has been set to >0 in advance.
- For positive peaks, set lower bound of Amplitude parameter(or Area parameter) to >0 if no bound has been set or the bound has been set to <0 in advance.
|
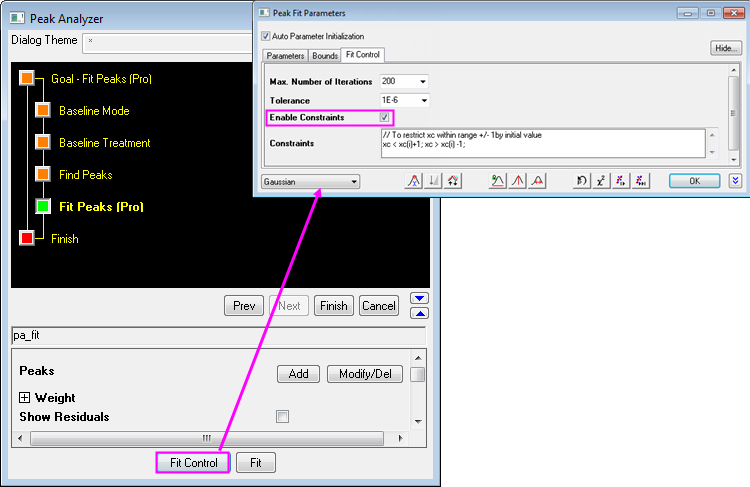
Set Linear Constraints
- Click Fit Control button to open Peak Fit Parameters dialog and go to Fit Control tab.
- Check Enable Constraints checkbox to enable editing Constraints text box.
- Input constraints in Constraints text box.
| Go to this table to learn how to write linear constraints.
|
See Also
|
Topics covered in this section:
|
|