19.1.5 Finding Peaks with the Peak AnalyzerFindPeak-PA
If the Find Peaks radio button is selected in the Goal group in the Start page of the Peak Analyzer, you can use the Peak Analyzer to create a baseline, subtract it from the input data and then find the peaks in it. A typical wizard map corresponding to this mode is as follows:
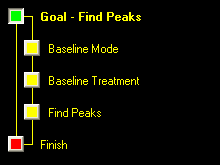
The Baseline Mode page allows you to choose a baseline mode and create the baseline. Then you can go to the Baseline Treatment page to subtract the baseline from the input data. This may help improve the accuracy of peak finding. Finally, in the Find Peaks page, you can find the peaks and specify how to mark the found peaks.
Peak finding in the Find Peaks page include automatic peak finding by the Peak Analyzer and manual peak editing. For automatic peak finding, you can select a method, configure the settings in the Find Peaks Settings branch and then click the Find button. Available methods for auto peak finding include:
- Local Maximum
- Window Search
- 1st Derivative
- 2nd Derivative (OriginPro only)
- Residual after 1st Derivative (OriginPro only)
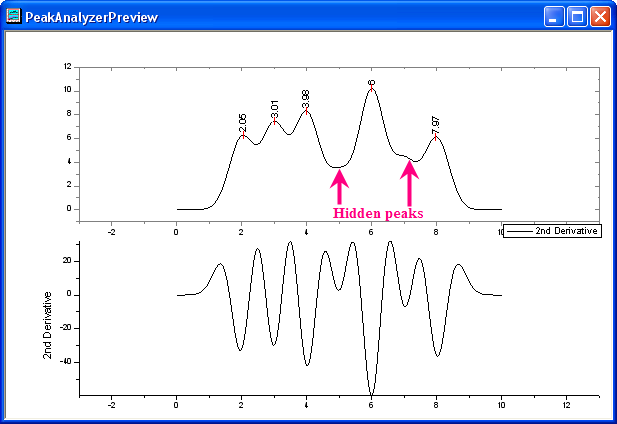
If the spectrum data includes hidden peaks, the 2nd derivative and the residual after 1st derivative methods should be used, because they work better in finding those hidden peaks. You can also turn on the 2nd derivative plot in the graph to locate the hidden peaks yourself.
To edit the peaks manually, clear the Auto Find check box and then use the Add, Modify/Del or Clear All buttons. The information of the peaks can be saved to a .dat file for later use.
|
Please see the reference for more details on the related pages:
|
|