19.1.10.2 Peak Analyzer, Baseline Mode PagePeakAnalyzer-BaselineMode
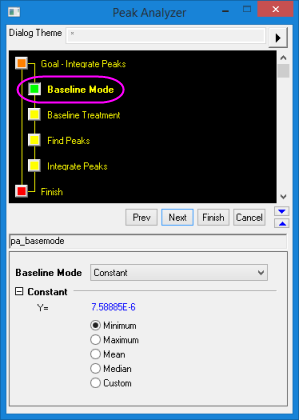
Use the Baseline Mode page to create a baseline.
- Menu Command: Analysis: Peaks and Baseline: Peak Analyzer: Open Dialog
- Window Types: Workbook, Graph
Dialog Theme
Baseline Mode
There are between four and eight Baseline Modes, depending upon your selected Goal. Some Baseline Modes (e.g. User Defined) create additional controls on this page, while others add a page to the Wizard Map.
| Baseline Mode
|
Description
|
| Constant
|
Baseline is a horizontal line where Y= Constant. Options include Minimum, Maximum, Mean and Median of the data, and Custom for editing the Y value.
|
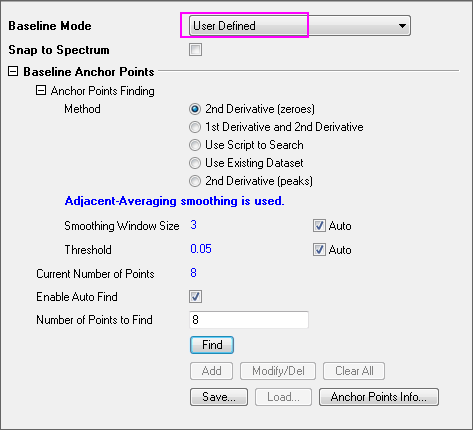
| User Defined
|
You can create a user defined baseline using one of five methods for finding anchor points:
- 2nd Derivative (zeroes): Use the 2nd Derivative (zeroes) method for baseline detection.
- 1st Derivative and 2nd Derivative: Use the 1st Derivative and 2nd Derivative method for baseline detection (this method is more powerful when the baseline is approximately constant).
- Use Script to Search: Use pre-defined LabTalk script to customize the method of auto finding anchor points. See this example for details.
- Use Existing Dataset: Use an existing dataset as the XY coordinates of baseline anchor points.
- Dataset: You can select a pair of XY columns from Dataset Browser which will display after clicking
 button. You can also input range notation eg., (A,C), (2,3), to refer to relative columns in the worksheet where target dataset locates. Note that such range notation only works for data from worksheet rather than graph. button. You can also input range notation eg., (A,C), (2,3), to refer to relative columns in the worksheet where target dataset locates. Note that such range notation only works for data from worksheet rather than graph.
- Current Number of points: Read only, display the current number of anchor points.
- 2nd Derivative (peaks): Use the 2nd Derivative (peaks) method for baseline detection (this method is more recommended if many data points' 2nd derivative approaches to 0).
|
| Use Existing Dataset
|
Use an existing dataset as the XY coordinates of baseline anchor points. You can input range notation eg., (A,C), (2,3), to refer to relative columns in the worksheet where target dataset locates. Note that such range notation only works for data from worksheet rather than graph.
Offset Baseline: Enter a value in this text box to offset the baseline.
|
| XPS
|
The Peak Analyzer will allow you to define an X-ray photoemission spectrum special baseline. For more details, please refer to the Peak Analyzer, XPS Baseline Page.
|
| None (Y=0)
|
The Peak Analyzer will use Y=0 as baseline.
|
| Min&Max
|
When detecting positive peaks, minimum value in selected data range will be used as baseline; whereas, maximum value will be used as baseline for detecting negative peaks. Note that this option is only available when Goal is Find Peaks.
|
| End Points Weighted
|
Create a smoothed curve as baseline using data points from two ends of the input data.
Note: This method depends heavily on the selection of end points. You should select the end points fraction very carefully.
|
| Straight Line
|
Create a straight line as baseline by setting the Y intercept and slope. The default value of A(Intercept) and B(Slope) is obtained by connecting the two end points of the data; you can clear the Auto check box to enter the desired values in the edit boxes.
Please note, the digits of default values of A(Intercept) and B(Slope) is decided by the digits settings in the Numeric Format tab of Options dialog.
|
| Asymmetric Least Squares Smoothing
|
Create a smooth baseline based on Asymmetric Least Squares (ALS) correction method. For more details, please refer to the Peak Analyzer, Asymmetric Least Squares Smoothing Baseline Page.
|
User-defined Anchor Points Options
When Baseline Mode = User Defined, these controls are added to the page.
| Snap to Spectrum
|
Use this to specify whether you want the baseline anchor points to be snapped to the spectrum data. If this is selected, the baseline anchor points will be pulled onto the spectrum as you add or move them.
|
| Smooth Parameter
|
The 2nd Derivative (zeroes) (adjacent averaging smoothing used), 2nd Derivative (peaks) (Savitzky-Golay smoothing used) and 1st Derivative and 2nd Derivative (Savitzky-Golay smoothing used) mode will smooth the data before finding anchor point, but smooth results will not output to the data.
- To increase the smoothness of the result, one can increase smoothing windows size. But for very large window size, adjacent averaging may depart from the input signal too much, whereas Savitzky-Golay can still preserve the overall profile.
- Threshold can influence anchor point finding. Larger threshold enable more baseline point be found.
- Smoothing Polynomial Order
- This is only available when 1st Derivative and 2nd Derivative is chosen and it specifies the polynomial order for Savitzky-Golay smoothing fitting.
|
| Use Script to Search
|
- It specifies the data range of the X coordinates of the baseline anchor points.
- It specifies the data range of the Y coordinates of the baseline anchor points.
- You may write LabTalk script as Before Formula Script for X= or Y= definition.
|
| Anchor Points Adjusting Options
|
Anchor points adjusting is available for 2nd Derivative (both zeroes and peaks), 1st Derivative and 2nd Derivative and Use Script to Search.
Current Number of Points: The current number of baseline anchor points is displayed here.
Enable Auto Find:
Specify whether you want the Peak Analyzer to automatically find the baseline anchor points. When selected, the Add, Modify/Del and Clear All buttons are disabled.
Number of Points to Find:
Enter the desired number of baseline anchor points here.
Find:
Click this button to find the baseline anchor points in the spectrum data.
Add:
This button is enabled only when Enable Auto Find is not selected. With this option, you can manually add baseline anchor points by double-clicking on the preview graph containing the spectrum data. The coordinates of mouse click will be shown in Data Display Window for better selection.
Modify/Del:
This button is enabled only when Enable Auto Find is not selected. With this option, you can manually move or delete existing baseline anchor points. The coordinates of selected anchor points will be shown in Data Display Window for better identification.
Clear All:
This button is enabled only when Enable Auto Find is not selected. When you click this button, all existing baseline anchor points are deleted.
Save:
Save the current anchor point coordinates as an Anchor Info File (*.DAT format).
Load:
Load a previously saved Anchor Info File. (*.DAT format)
Anchor Points Info:
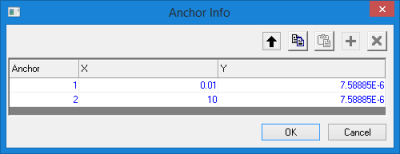 - Open the Anchor Info dialog to check the current anchor point coordinates. You can add or delete a anchor point, and edit the point location in the dialog, if the Enable Auto Find check box is not selected. You can also copy the point coordinates or paste a specific value for a point X/Y coordinate by the Copy/Paste button.
- Anchor Info Dialog Button Group
 - Sort anchor points in ascending order by X values. - Sort anchor points in ascending order by X values.
 - Copy selected anchor points in anchor points list. - Copy selected anchor points in anchor points list.
 - Paste copied anchor points in clipboard into the anchor points list in Anchor Info dialog. - Paste copied anchor points in clipboard into the anchor points list in Anchor Info dialog.
 - Add an anchor point to the end of anchor points list. - Add an anchor point to the end of anchor points list.
 - Remove selected anchor point(s) in anchor points list. - Remove selected anchor point(s) in anchor points list.
|
|