19.1.10.9 Peak Analyzer, Find Peaks PagePeakAnalyzer-FindPeaks
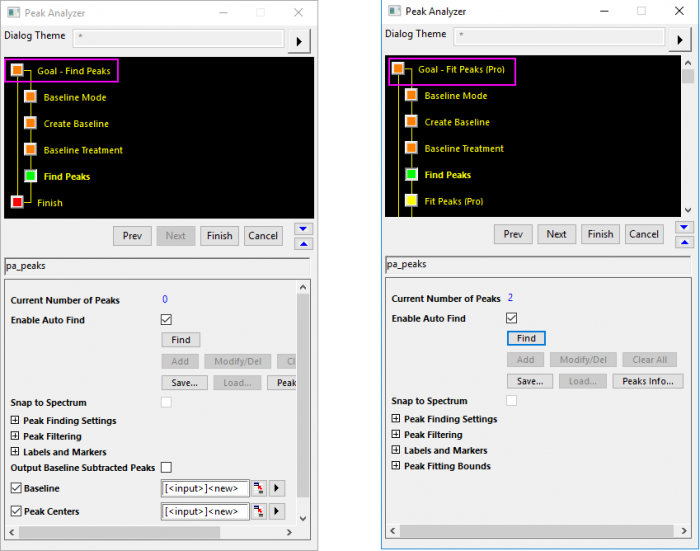
This page is available when Goal = Integrate Peaks, Find Peaks or Fit Peaks(Pro).
- Menu Command: Analysis: Peaks and Baseline: Peak Analyzer: Open Dialog
- Window Types: Workbook, Graph
Dialog Theme
Find Peaks Controls
| Current Number of Peaks
|
This is read-only. It shows the number of peaks that have been found.
|
| Enable Auto Find
|
Use this to specify whether you want the Peak Analyzer to find the peaks automatically. When this check box is selected, the Add, Modify/Del, Clear All and Load buttons are disabled.
|
| Find
|
This button makes Origin find peaks using the current settings in the Find Peaks Settings and Peak Filtering groups.
|
| Add
|
This button is enabled only when the Auto Find check box is not selected. When this button is clicked, you are allowed to add peaks manually, by double-clicking on the preview graph. The coordinates of mouse click will be shown in Data Display Window for better selection.
|
| Modify/Del
|
This button is enabled only when the Auto Find check box is not selected. When this button is clicked, you are allowed to modify or delete the peaks on the preview graph. The coordinates of selected anchor points will be shown in Data Display Window for better identification.
|
| Clear All
|
This button is enabled only when the Auto Find check box is not selected. When this button is clicked, all existing peaks are removed.
|
| Save
|
Click this button to save the current peak info to a .dat file.
|
| Load
|
This button is enabled only when the Auto Find check box is not selected. When this button is clicked, you can load peak info from a file.
|
| Peaks Info
|
When this button is clicked, the Peak Info dialog opens, showing you the information (centers and heights) of the peaks. You can sort peaks, add or delete a peak, and edit the peak info in the dialog, if the Auto Find check box is not selected. You can also copy the peak info or paste a specific center/height value for a peak by the Copy/Paste button.
Peak Info Dialog Button Group
 - Sort peak anchor points in ascending order by peak centers. - Sort peak anchor points in ascending order by peak centers.
 - Copy selected peak anchor points in anchor points list. - Copy selected peak anchor points in anchor points list.
 - Paste copied peak anchor points in clipboard into the peak anchor points list in Peak Info dialog. - Paste copied peak anchor points in clipboard into the peak anchor points list in Peak Info dialog.
 - Add a peak anchor point to the end of peak anchor points list. - Add a peak anchor point to the end of peak anchor points list.
 - Remove selected peak anchor point(s) in anchor points list. - Remove selected peak anchor point(s) in anchor points list.
|
| Snap to Spectrum
|
This checkbox is enabled only when Enable Auto Find is unchecked. Use this checkbox to specify whether you want the peak center anchor points to be snapped to the spectrum data. If this is selected, the peak center anchor points will be pulled onto the spectrum as you add or move them.
|
The Peak Finding Settings Group
| Show 2nd Derivative
|
Use this check box to show or hide the panel that plots the second derivative of the spectrum data and its smoothed data(in red color) in the preview graph. The second derivative can be helpful in locating peaks (including hidden peaks) in the spectrum.
|
| Smooth Window Size
|
Savitzky-Golay smoothing can be performed on the spectrum data before the peak finding. If you want to perform the smoothing, enter the desired window size (a positive integer) in the moving window for the Savitzky-Golay smoothing. Otherwise, enter 0 in this text box. There is an Auto check box to the right. When it is selected, the smooth points will be determined by the Peak Analyzer automatically. If you want to specify the smooth points, uncheck this box.
|
| Method
|
Use this drop-down list to select the method to find the peaks.
- Local Maximum: Use the Local Maximum method to find the peaks in the spectrum.
- Window Search: Use the Window Search method to find the peaks in the spectrum.
- 1st Derivative: Use the first derivative method to find the peaks in the spectrum.
- 2nd Derivative (Search Hidden Peaks)(OriginPro only): Use the 2nd Derivative method to find the peaks in the spectrum. This method is capable of detecting hidden peaks in the data.
- Residual after 1st Derivative (Search Hidden Peaks)(OriginPro only): Use the Residual after 1st Derivative method to find the peaks in the spectrum. This method is capable of detecting hidden peaks in the data.
- Fourier Self-Deconvolution(Pro):Use the Fourier Self-Deconvolution algorithm to find overlapping peaks in the spectrum. Note: The position and integrated area for each peak are preserved in the deconvolved spectrum.
|
| Direction
|
Use this drop-down list to specify whether or not to find peaks with a specified direction only.
- Positive: Find positive peaks only.
- Negative: Find negative peaks only.
- Both: Find both positive and negative peaks.
|
| Local Points
|
This is available only when Local Maximum or Fourier Self-Deconvolution(Pro) is selected in the Method drop-down list. It specifies the number of points in the local area, which will be used for finding the peaks with the Local Maximum or Fourier Self-Deconvolution(Pro) method.
|
| Size Option
|
This is available only when Window Search is selected in the Method drop-down list. This drop-down list specifies how the Height and Width values (see below) are interpreted.
- Raw Size: The values will be interpreted as raw sizes.
- Percent of Raw Data: The values will be interpreted as the percentages with respect to the total width or maximum height of the spectrum data.
|
| Height
|
This is available only when Window Search is selected in the Method drop-down list. It specifies the height of the rectangle, which is used to find the peaks. There is an Auto check box to the right. If it is selected, the Peak Analyzer will determine the value automatically. Therefore, if you want to edit the value, please uncheck this check box.
|
| Width
|
This is available only when Window Search is selected in the Method drop-down list. It specifies the width of the rectangle, which is used to find the peaks. There is an Auto check box to the right. If it is selected, the Peak Analyzer will determine the value automatically. Therefore, if you want to edit the value, please uncheck this check box.
|
| Smooth Derivative
|
This is available only when 1st Derivative(None and SG only), 2nd Derivative (Search Hidden Peaks) or Residual after 1st Derivative (Search Hidden Peaks) (None and SG only) is selected in the Method drop-down list. Specifies the method to smooth the derivative of spectrum data.
- Method
- Specifies the smoothing method.
- None: Do not use any smoothing method.
- FFT: Specifies the FFT Filter method to smooth derivative.
- ADJ: Specifies the Adjacent Averaging method to smooth derivative.
- SG: Specifies the Savitsky-Golay method to get smooth derivative.
- Quadratic SG: Specifies the Quadratic Savitsky-Golay method to smooth derivative.
- Cut Off Frequency
- It is available only when the Smooth Derivative drop-down list selected to FFT. It specifies the cutoff frequency.
- Points of Window
- It is available only when the Smooth Derivative drop-down list selected to ADJ, SG and Quadratic SG. The greater this value, the greater the degree of smoothing. A value of zero for this parameter will leave the data unsmoothed.
- Polynominal Order
- It is available when the Smooth Derivative drop-down list selected to ADJ and Quadratic SG. It specifies the polynomial order.
|
| Gamma
|
This is available only when Fourier Self-Deconvolution(Pro) is selected in the Method drop-down list.
Specify the line shape width. A default value is provided for Gamma; Uncheck Auto checkbox to specify a custom value. The line shape will be used to deconvolve the spectrum. Generally the larger Gamma is, the narrower the deconvolved peak becomes.
|
| Smoothing Factor(0-1)
|
This is available only when Fourier Self-Deconvolution(Pro) is selected in the Method drop-down list.
Specify Smoothing Factor to smooth the deconvolved spectrum. Smoothing factor must be between 0 and 1. The larger the factor, the smoother the deconvolved spectrum, and the wider the deconvolved peaks.
|
The Peak Filtering Group
| Method
|
Use this drop-down list to specify whether you want to limit the number of found peaks or the height of the peaks.
- None: Select this option if you do not want to limit the number of found peaks nor the heights of the peaks.
- By Height%: When you select this option and specify a threshold height in percentage with the Threshold Height(%) text box, only the peaks whose heights are not less than the threshold height will be found when you click the Find button. There is an Auto check box to the right. When it is selected, the threshold value will be determined by the Peak Analyzer automatically. If you want to specify the height, make sure the clear this check box.
- By Number: If you select this option and enter a value in the Number of Peaks text box, you can limit the number of peaks that will be found after you click the Find button. There is an Auto check box to the right. When it is selected, the smooth points will be determined by the Peak Analyzer automatically. If you want to specify the number of peaks, make sure the clear this check box.
- By Height Value: When you select this option and specify a actual threshold height with the Threshold Height text box, only the peaks whose heights are not less than the threshold height will be found when you click the Find button. There is an Auto check box to the right. When it is selected, the threshold value will be determined by the Peak Analyzer automatically. If you want to specify the height, make sure the clear this check box.
- Custom: If you select this option, you can enter the custom condition to combine more than one filtering methods to find the peaks.
|
| Threshold Height(%)
|
This text box is available only when By Height % is selected in the Filter Method drop-down list. You can use it to specify the minimum height of the found peaks. It is a percent of a reference value, which is defined as follows:
First, get the maximum value and the minimum value of the spectrum (if a baseline has been subtracted from it, use the spectrum after subtraction). Then compare the absolute values of the maximum value and the minimum value. The greater one will be regarded as the reference value of the Threshold Height.
|
| Number of Peaks
|
This text box is available only when By Number is selected in the Filter Method drop-down list. You can use it to specify the maximum number of the found peaks.
|
| Threshold Height
|
This text box is available only when By Height Value is selected in the Filter Method drop-down list. You can use it to specify the minimum height of the found peaks. It is a actual height value, which is different from the Threshold Height(%).
|
| Filter Condition
|
This text box is available only when Custom is selected in the Filter Method drop-down list. You can enter different combined conditions to filter the peaks, such as "n<=3 AND hp>=0.2" which means peak number is less than or equal to 3 and meanwhile the Height Percent is larger than or equal to 20%.
Here, Origin supports 4 predefined keywords(hp=Height Percent, h=Height Value, n=Peak Number and x=Peak's X Value) which can be combined to filter the peaks.
Please note, you can use natural language logical operators "AND", "OR", "NOT" and "LIKE" or you can use their symbolic equivalents (see Logical and Relational Operators).
|
The Labels and Markers Group
| Show Center Label
|
Use this check box to specify whether or not to show a label for each peak center.
|
| Center Label
|
Select the type of center labels.
- X of Peaks: Use the X coordinates of the peak centers as center labels.
- Y of Peaks: Use the Y coordinates of the peak centers as center labels.
- Indices: Use the indices of the peaks as center labels.
- (X,Y) of Peaks: Use the X and Y coordinates of the peak centers as center labels.
|
| Rotate Center Label
|
Use this check box to specify whether or not to rotate the center labels.
|
The Output Baseline Subtracted Peaks check box
This check box is available only when Goal is set to Find Peaks, since Origin 2019b.
Once you have specified the baseline for the input curve to find peaks, you might need to output the peak-finding results without the baseline. Then you can check this check box to subtract the baseline from the peak height. The output results can be as below:
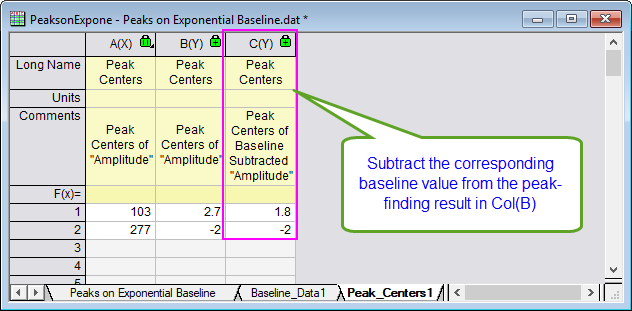
Please note, when the Baseline Mode is set to None or Min&Max, this check box will not be available.
The Peak Fitting Bounds Group
This group is available only when Goal is set to Fit Peaks.
| Preset Bounds by
|
Use this drop-down list to specify whether and how you want to set boundaries to the found peaks while fitting.
- None: Select this option if you do not want to preset the boundaries of the peak center, widths nor heights of found peaks.
- By Difference: Specify boundaries by difference between center and upper/lower bound. When you select this option and specify values of Center, Width and/or Height/Area, peaks fitting will be limited to the center, width and/or height boundaries you set.
- By Percentage: Specify boundaries by the percentage of the difference between center and upper/lower bound. When you select this option and specify the percentage values of Center(%), Width(%) or Height/Area(%), peaks fitting will be limited to the center, width and/or height boundaries you set.
|
| Center
|
This option is available only when By Difference is selected for Preset Bounds by. Check the checkbox and specify the upper and lower bounds for peak center.
|
| Width
|
This option is available only when By Difference is selected for Preset Bounds by. Check the checkbox and specify the the upper and lower bounds for peak width.
|
| Height(Area)
|
This option is available only when By Difference is selected for Preset Bounds by. Check the checkbox and specify the upper and lower bounds of peak height or peak area.
|
| Center(%)
|
This option is available only when By Percentage is selected for Preset Bounds by. Check the checkbox and specify the upper and lower bounds in percentage of peak center.
|
| Width(%)
|
This option is available only when By Percentage is selected for Preset Bounds by. Check the checkbox and specify the upper and lower bounds in percentage of peak width.
|
| Height(Area)(%)
|
This option is available only when By Percentage is selected for Preset Bounds by. Check the checkbox and specify the upper and lower bounds in percentage of peak height or peak area.
|
|