15.3.4.4.8 Defining a Peak FunctionPeakAnalyzer-DefinePeakFunc
When you use the Peak Analyzer to fit peaks ( OriginPro ), you can select a built-in function for each peak in the Peak Fit Parameters dialog, or you can create a user-defined function with the Fitting Function Organizer or Fitting Function Builder. Defining a peak function is much like creating any user-defined fitting function, with these added caveats:
- To be used in the Peak Analyzer, the function should be in the PFW category and the Peak Function check box should be selected when defining the function.
- To make existing fitting functions in other categories available for peak fitting, choose Tools: Fitting Function Organizer. Right-click on a function and choose Move to or Share to and in the dialog that opens, select PFW as the drop-down list option.
- To make peak functions available for Quick Peaks Gadget or Multiple Peak Fit tool, you should select Peak Function category.
- If you want to define a function to fit your baseline in Peak Analyzer (OriginPro only), you must put the user-defined function into the Baseline category.
- At minimum, the function must have four parameters that correspond to different peak characteristics. The parameter attributes are set with the Peak Attributes column on the Function Body page of Fitting Function Builder. The first parameter should be named y0 and should be assigned the attribute Offset/Baseline. The other parameters may be assigned arbitrary names, but should be assigned attributes of X Center, X Width and Amplitude/Area.
 | If a colleague has shared an FDF file (Origin Function Definition File) with you, you can add it to your Origin installation by simply dropping it onto your Origin workspace:
- Beginning with Origin 2018, category information is saved into the FDF file. When dropping this file onto Origin, the category is automatically assigned to the author's designated category.
- In earlier versions, as you drop the FDF file onto the Origin workspace, a Select Category to Add Function dilaog will open, allowing you to assign a category.
|
Example 1: Origin C
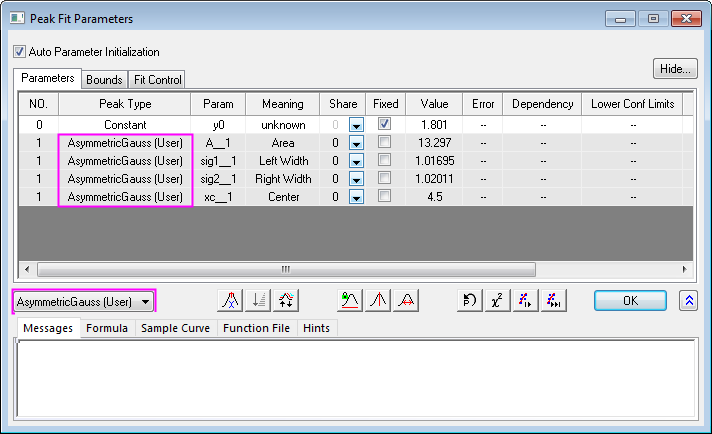
The following example demonstrates how to define a peak function named AsymmetricGauss and use it in Peak Analyzer.
The peak function to be defined is expressed as below:
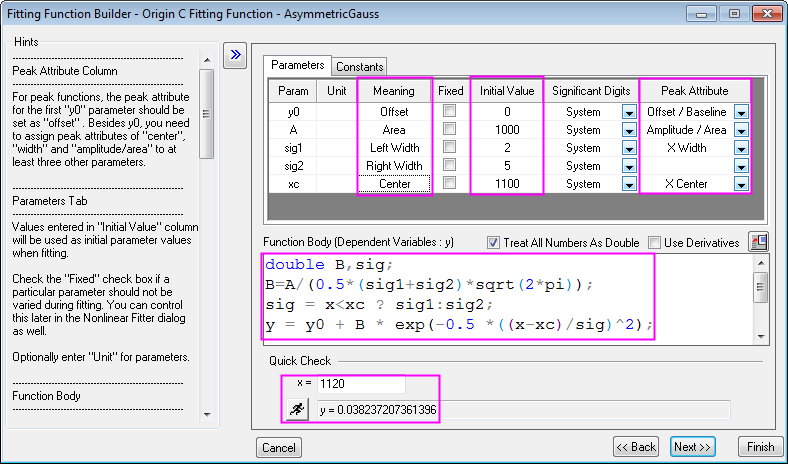
- double B,sig;
- B=A/(0.5*(sig1+sig2)*sqrt(2*pi));
- sig = x<xc ? sig1:sig2;
- y = y0 + B * exp(-0.5 *((x-xc)/sig)^2);
where x is independent variable, y is dependent variable, y0, sig1, sig2, xc are parameters corresponding to attributes offset, peak area, left peak width, right peak width, peak center, respectively.
There are general 7 steps in defining a peak function for fitting in Peak Analyzer:
1. Hit F8 key or go to menu Tools: Fitting Function Builder to open.
2. Click Next to go to the Name and Type page, select PFW category from Select or create a Category drop-down list, input AsymmetricGauss as Function Name. Select Origin C from Function Type panel.
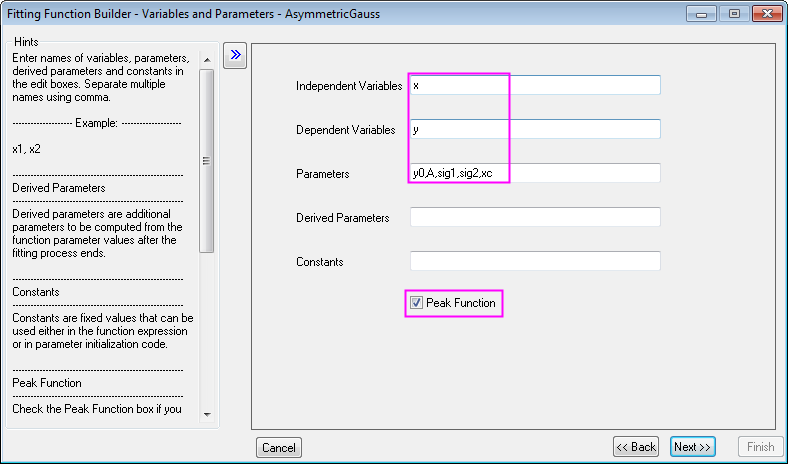
3. Click Next to go to the Variables and Parameters page, input variables and parameters as shown below and check Peak Function check box:
4. Click Next to go to the Origin C Fitting Function page. Click on each cell in Peak Attribute column to set peak attributes for each parameter. Enter initial parameter values. Input meaning for each parameter. Enter function equations in Function Body edit box and do a quick check at x = 1120 to make sure the expression is written correctly as shown below:
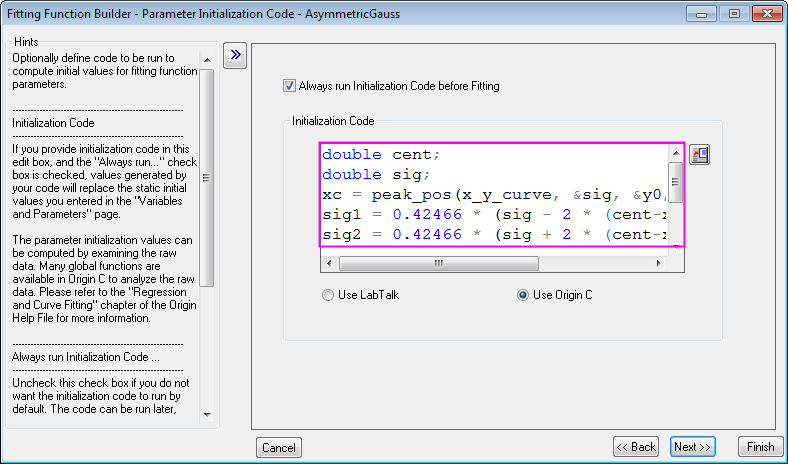
5. Click Next button to go to the Parameter Initialization Code page, and enter the following codes into the Initialization Code edit box as shown below:
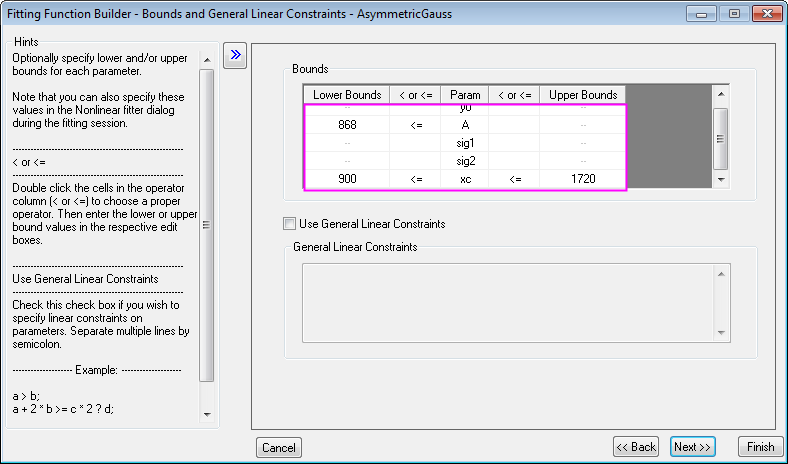
6. Click Next button to go to the Bounds and General Linear Constraints page. Double click in cells in < or <= column(s) to toggle operators and then enter lower and upper bounds. Setting bounds for each parameter will confine the fitted results in sensible range as show below:
7. Click Finish button and the peak function is created and placed in PFW category.
After this, you can perform peak fitting with this function in Peak Analyzer by choosing it from the Peak Type drop-down list in the Peak Fit Parameters dialog.
Example 2: Python
Starting with Origin 2021b, you can define peak fitting functions using Python. These functions can then be used in the Peak Analyzer, the Multiple Peak Fit tool and the NLFit dialog.
- Open Fitting Function Builder (Tools: Fitting Function Builder or F8), select the Create a New Function radio button, then click Next.
- Set Select or create a Category = PFW and enter Function Name = MyPyGaussV. Set Function Model = Explicit and Function Type = Python Function (Vector).
- Enter Independent Variables = x, Dependent Variables = y, and in the Parameters box, enter y0, xc, A, w (should be comma-separated).
- Check the Peak Function box and click Next.
- Enter the following information, making sure to set the Peak Attribute drop-down list for each row (each Param):
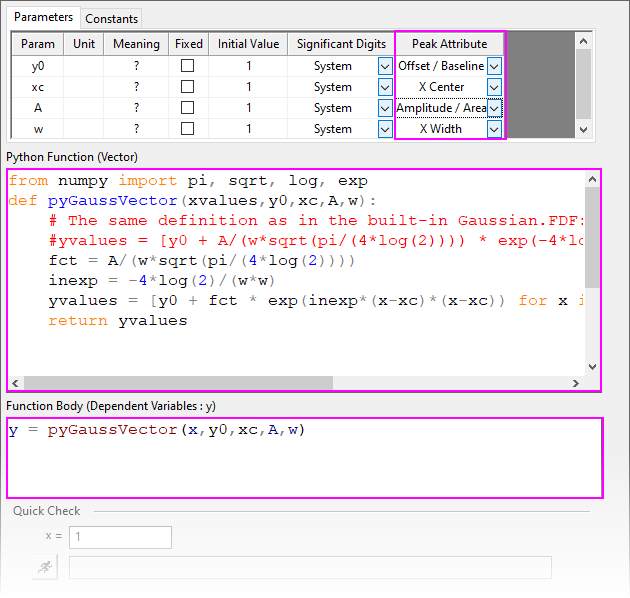 - Python Function (Vector)
from numpy import pi, sqrt, log, exp
def pyGaussVector(xvalues,y0,xc,A,w):
	# The same definition as in the built-in Gaussian.FDF:
	#yvalues = [y0 + A/(w*sqrt(pi/(4*log(2)))) * exp(-4*log(2)*(x-xc)*(x-xc)/(w*w)) for x in xvalues]
	fct = A/(w*sqrt(pi/(4*log(2))))
	inexp = -4*log(2)/(w*w)
	yvalues = [y0 + fct * exp(inexp*(x-xc)*(x-xc)) for x in xvalues]
	return yvalues
- Function Body
y = pyGaussVector(x,y0,xc,A,w)
- The next page -- the Script Before Install page -- is a Python-only page where you specify LabTalk code used to check the user's system for Python packages required by the function. Note that it cannot be left blank.
- Click Next to go to the Script Before Install page and add the following:
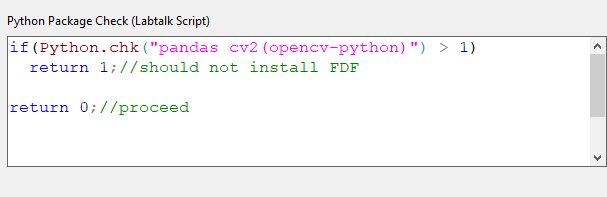 - Python Package Check (LabTalk Script)
if(Python.chk("pandas cv2(opencv-python)") > 1)
  return 1;//should not install FDF

return 0;//proceed
- Since there is nothing further that we need to set, click Finish to save your function and close the dialog.
- Choose Data: Connect to File: Text/CSV, browse to <Origin Program>\Samples\Curve Fitting, select MultiplePeaks.dat, accept default import options and click OK to import the file.
- Click on the column D(Y) heading to select the column and click the Scatter button
 to create a scatter plot. to create a scatter plot.
- Click Analysis: Peaks and Baseline: Peak Analyzer: Open Dialog.
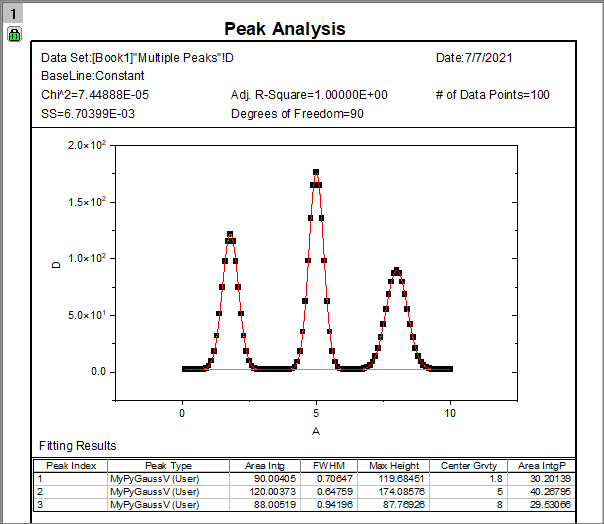
On the Goal page, click Fit Peaks (Pro), then click Next four times to arrive at the Fit Peaks (Pro) page:
- Click the Fit Control button at the bottom of the page. In the middle of the Peak Fit Parameters dialog that opens, change Gaussian to MyPyGaussV (User) and click OK to close this dialog.
- Click the Finish button to fit multiple peaks using your user-defined Python function.
|