9.6.4 The (Plot Details) Lines TabPD-Dialog-BoxChartLine-Tab
The Lines tab provides controls for customizing the whisker(vertical+cap) lines, the median line, the mean line and distribution curve that display at Box Chart.
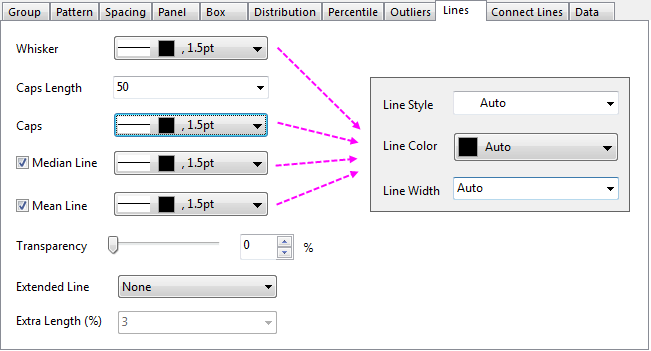
Whisker
This popup dialog controls display of the Whisker in the graph.
When the Style ,Width and Color options are set to Auto, the whisker line format will match the box border.
| Line Style
|
Select the whisker style from this drop-down list.
|
| Line Width
|
Select or type the whisker width in this combination box. The line width is measured in points, where 1 point=1/72 inch.
|
| Line Color
|
Specify the whisker color from this drop-down list.
|
Caps Length
Set the length for the caps line in this combination box. The caps length is a percent of the box width value.
Caps
This popup dialog controls display of the Whisker in the graph.
When the Style ,Width and Color options are set to Auto, the caps line format will match the whisker.
| Line Style
|
Select the caps line style from this drop-down list.
|
| Line Width
|
Select or type the caps line width in this combination box. The line width is measured in points, where 1 point=1/72 inch.
|
| Line Color
|
Specify the caps line color from this drop-down list.
|
Median Line
This popup dialog controls display of the median line in the graph.
When the following options are set to Auto, the median line format will match the box border.
| Line Style
|
Select the median line style from this drop-down list.
|
| Line Width
|
Select or type the median line width in this combination box. The line width is measured in points, where 1 point=1/72 inch.
|
| Line Color
|
Specify the median line color from this drop-down list.
|
Mean Line
This popup dialog controls display of the mean line in the graph.
When the following options set to Auto, the mean line format will match the box border.
| Line Style
|
Select the mean line style from this drop-down list.
|
| Line Width
|
Select or type the mean line width in this combination box. The line width is measured in points, where 1 point=1/72 inch.
|
| Line Color
|
Specify the mean line color from this drop-down list.
|
Transparency
This controls line transparency. Move the slider or type a desired integer, from 0 to 100, in the combination box. Note that 0 is fully opaque; 100 is fully transparent.
Extended Line
These controls enable the mean or median line to be extended out the box. It can be set to create this kind of box chart, 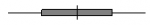 . .
| Extended Line
|
Specify to extend the Mean, Median or both to be out of the box
|
| Extra Length(%)
|
Select or type the extra width of the line for each side. The value is measured in percent of the current box width.
|
|