9.6.5 The (Plot Details) Connect Lines TabPD-Dialog-BoxChartConLine-Tab
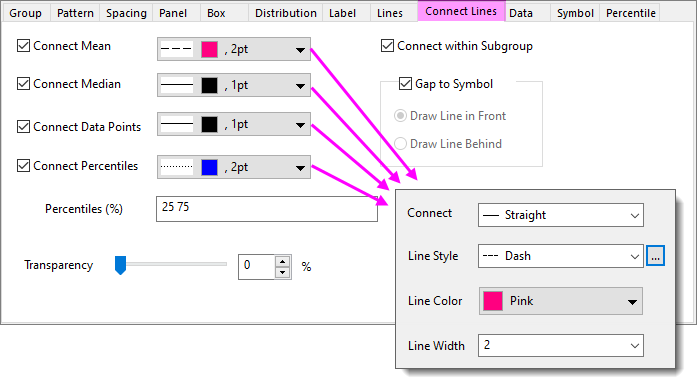
You can add the connect lines in the box chart to connect the Mean points, the Median points, the data points or the percentiles. The Connect Lines tab provides controls for customizing these connect lines.
Line Style Flyout
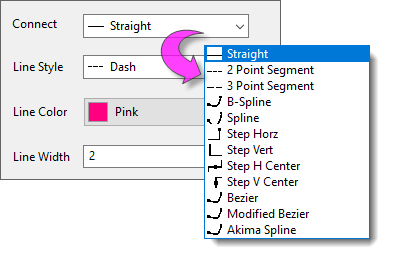
Controls for styling connecting lines are the same as those for styling line plots. See documentation for Plot Details Line Tab controls.
Connect Mean
Connect the Mean points of boxes in the box chart by a line. This popup controls the display of the Mean connected line.
| Line Style
|
Select the style for the Mean connected line from this drop-down list.
|
| Line Width
|
Select or type the width for the Mean connected line in this combination box. The line width is measured in points, where 1 point=1/72 inch.
|
| Line Color
|
Specify the Mean connect line color.
Note: If Color is set to Auto, the line color will follow the first plot's border color.
|
Connect Median
Connect the Median points of boxes in the box chart by a line. This popup controls the properties of the Median connected line.
| Line Style
|
Select the style for the Median connected line from this drop-down list.
|
| Line Width
|
Select or type the width for the Median connected line in this combination box. The line width is measured in points, where 1 point=1/72 inch.
|
| Line Color
|
Specify the Median connected line color.
Note: If Color is set to Auto, the line color will follow the first plot's border color.
|
Connect Data Points
Connect the data points of every test by a line. This check box only enables when Box Type contains Data. This popup controls the properties of the data points connected lines.
| Line Style
|
Select the style for the data points connected line from this drop-down list.
|
| Line Width
|
Select or type the width for the data points connected line in this combination box. The line width is measured in points, where 1 point=1/72 inch.
|
| Line Color
|
Specify the data points connect line color.
Note: If Color is set to Auto, the line color will follow the first plot's color.
|
Connect Percentiles
Connect certain percentiles of boxes in the box chart by a line. This popup controls display of the percentiles connected line.
| Line Style
|
Select the style for the percentiles connected line from this drop-down list.
|
| Line Width
|
Select or type the width for the percentiles connected line in this combination box. The line width is measured in points, where 1 point=1/72 inch.
|
| Line Color
|
Specify the percentiles connect line color.
Note: If Color is set to Auto, the line color will follow the first plot's border color.
|
Percentiles(%)
Type the custom percentiles values in edit box.
Note: Space should be used to separate numbers, e.g. 25 75.
Transparency
This controls the transparency of lines. Move the slider or type a desired integer, from 0 to 100, in the combination box. Note that 0 is fully opaque; 100 is fully transparent.
Connect within Subgroup
Check this check box so that connecting lines only connect elements within the same subgroup. Clearing the box connects all elements and ignores any subgrouping.
Gap to Symbol
This group is available only when the percentile symbol or data symbol is enable. You can use the check box Gap to Symbol to specify whether to add a gap between the symbols and the connect line.
Draw Line In Front/Draw Line Behind
Specify how to draw the line for the Line+Symbol plot: draw the line in front of or behind the symbol. These radio boxes will be available only when the Gap to Symbol check box is unchecked.
|