8.3.1.2 What is Saved with the Graph Template?Graph-Template-Elements
Graph windows are created from graph template files. Origin graph template files have an OTP file extension. Origin ships with a large number of built-in graph templates (system templates). These templates are used to create all of Origin's 100+ graph types and they can be modified and saved, to preserve your custom settings.
A graph template file differs from a graph window file (.OGG) in that templates do not store data. Rather, graph template files store important page and layer characteristics (page size, number of layers, scaling of text and drawing objects, etc.) and they also store data plot style information (plot type, plot colors, data labels, etc.). For more information, see "Attributes saved with the graph template," below.
Saving graph customizations to a template file
To save the active graph window as a graph template (.OTP) file:
- Activate the graph window and select File:Save Template As...
or
- Right-click on the window title bar and select Save Template As... from the shortcut menu.
Both actions open the open the template_saveas dialog box. For information on dialog box controls, see Saving a customized window as a template.
Attributes saved with the graph template
The graph page, each graph layer on the page, the axes, the tick labels, the axes labels, and text or object annotations, as well as the data plots, all have properties that can be saved to a graph template.
Attributes controlled from the Plot Details dialog box are saved with a graph template:
- The page tabs of the Plot Details dialog box.
- The layer tabs of the Plot Details dialog box.
- The data plot tabs of the Plot Details dialog box.
- The function, data point, error, and label tabs of the Plot Details dialog box.
The attributes controlled by these dialog boxes are saved with the graph template:
- The Axis dialog box.
- The dialog boxes that control graph annotations (text and drawing objects).
Additionally, the following graph window properties are saved to the template:
- Graph Long Name. You can preset Long Name for graph create from this template.
- Graph Short Name. You can preset Short Name for graph create from this template.
Notes:the graph Long Name/Short Name preset method can be accessed by theme. In the Save Format as Theme dialog, find branch
- page.Misc.PagePresetLongName.strVal to preset graph Long Name
- page.Misc.PagePresetShortName.strVal to preset graph Short Name
|
Finally...
- If when saving the graph template, you marked it as a "cloneable template", then information about the relationship of graph window plots and the structure of the source data, is saved with the graph template. To find out more, see Cloneable Templates.
- A preview image of the graph at the time of saving the template, is saved with the graph template. This preview is used to represent your template in the Plot menu and in the Template Library.
A note about data plot style holders
The details (or data plot styles) of each of the data plots in your graph window are saved in data plot style holders. Data plot style holders contain information about the type of data plot (for example, scatter, line, or column) and the settings for the data plot (for example, the settings on the Plot Details Symbol tab). When you save a graph window as a template, each data plot in each layer of the graph window has an associated data plot style holder.
Thus, when you create a graph based on this custom template, for each layer in your graph, the first data plot in the layer will display according to the information stored in the first data plot style holder for that layer. The second data plot in the layer will display according to the information stored in the second data plot style holder for that layer, and so on. As you add data plots to the layer, Origin searches for a data plot style holder that is not currently in use (for example, if you removed a data plot from the layer contents), and displays the data plot using the first data plot style holder found. If you add more data plots to the layer than there are style holders, Origin will display the data plot using the information in the last data plot style holder.
Additional Scripts Saved with Template
You are allowed to use specific commands to save some LabTalk scripts with the graph template. Here will have two commands supported since Origin 2021b:
- you can use the command page.info.system.plotting.LT$=

|
- New a project, import <Program Folder>\Samples\Graphing\Group.DAT into a new workbook.
- Highlight first columns and select Plot > Basic 2D : Scatter to create a plot.
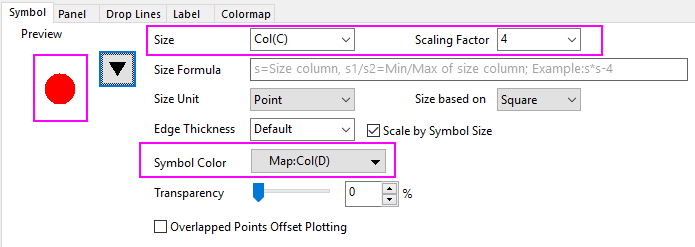
- Double-click on the plot to open the Plot Details dialog, select Solid Circle as symbol shape, select col(C) for Size and set Scaling Factor to 4, assign col(D) as Symbol Color mapping.
- To prepare to save the this template with the Symbol Size mapping and Symbol Color mapping, you need to firstly run script below:
page.info.system.plotting.LT$="worksheet -p 248 __TEMPLATE;"
Here, worksheet -p 248 __TEMPLATE; is the LabTalk command you want to save with the template to keep the column mapping information. __TEMPLATE is a key to notate the current window you want to save(as you haven't named it).
- Right click on window title, select Save Template As to open dialog, fill a name like myBnC, click OK.
- Activate back source workbook, select Plot : My Templates : myBnC, you can create a same graph.
|
- you can use the command page.info.system.plotting.LTAfter$
For example, if you want to "Fit Page to Layers" with Border Width = 8 after plotting, you can run
page.info.system.plotting.LTAfter$="pfit2l borderwid:=8;"
|