6.1.6 Adding a Data Plot to Existing GraphAdding-Plot
Summary
Sometimes, once you have plotted a dataset in to a graph layer, you might desire to plot one more dataset into same graph layer.
Four methods might be available for this case:
- Drag and drop dataset into the the graph layer
- You can add data to a graph by drag-and-drop. When using this method, Origin relies on worksheet Column Plot Designations to create the plot.
- Use Plot Setup dialog to add the plot
- The Plot Setup dialog can be used to add/reorder/arrange data plots in an exiting graph. This dialog provides flexibility in selecting the source data sheet and in specifying how data are to be plotted.
- Use Layer Contents dialog to add the plot
- The Layer Contents dialog box is used to add or remove data plots from a graph layer, group and ungroup plots, and reorder (change the drawing order of) the data plots.
- Use Copy Plot button in mini toolbar to add a existing plot into the graph layer
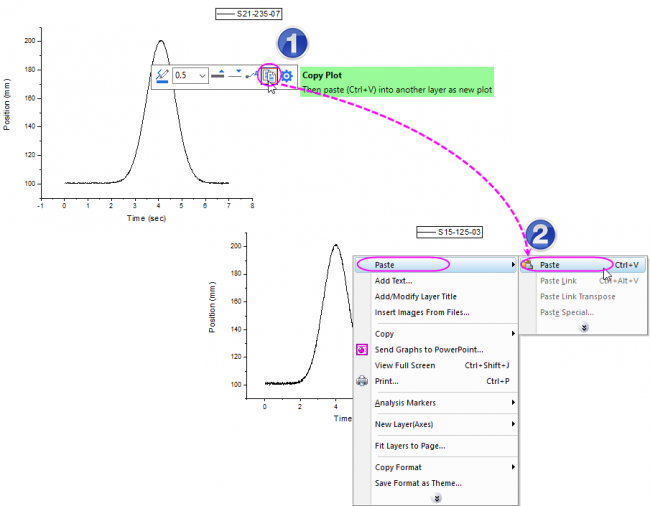
- Since Origin 2020, you can use the Copy Plot button in mini toolbar to copy one plot from a graph and paste this plot into another graph layer. In this way, you can add an existing plot into another existing graph layer.
What you will learn
This tutorial will show you how to:
- Use drag-and-drop to add data to a graph layer
- Use the Plot Setup dialog to add data to a graph layer
- Use the Layer Contents dialog to add data to a graph layer
- Use mini toolbar to copy a plot and paste it into a graph layer
- Group the plots in Object Manager
- Use the Legend Update dialog to modify the graph legend
Steps
Inputting data and plotting
- Click the New Project button on the Standard toolbar, to begin with a new project.
- Click the Import Wizard button on the Standard toolbar. The Import Wizard opens. (Note that if this is the first time that you have started the Import Wizard, you will experience a slight delay as Origin compiles the necessary files.)
- Verify that the ASCII radio button is selected in the Data Type group.
- Click the browse button to the right of the File text box. Navigate to the Origin folder; browse to the Samples folder and then the Import and Export folder.
- Press CTRL and select files S15-125-03.dat, S21-235-07.dat, and S32-014-04.dat, then click Add Files.
- Click OK.
- Leave the Import Filters for current Data Type as Data Folder: VarsFromFileNameAndHeader. (This filter has the settings to use when importing the file.)
- Set the Import Mode as Start New Sheets.
- Click the Finish button. The three data files import into the workbook, each as a new sheet. You will have a book with three sheets: Trial Run 1, Trial Run 2, and Trial Run 3.
- Select the Trial Run 1 sheet, highlight the D(Y) column. Click the Line button on the 2D Graphs toolbar. A new graph is created and named as Graph1.
Adding plot by
Using Drag-and-Drop
- Right-click on the title bar of Graph1 to select Duplicate from the context menu to duplicate the graph window.
- Activate this new graph window, and move it to the gray space of Origin workspace(make it not be covered by the source workbook).
- Click to select the second sheet "Trial Run 2" of source workbook, and then click on the column header of col(D) to select it. Move the cursor to the right border of col(D) until the Drag-and-drop icon
 appears. appears.
- Then you can drag-and-drop the column into the graph window.
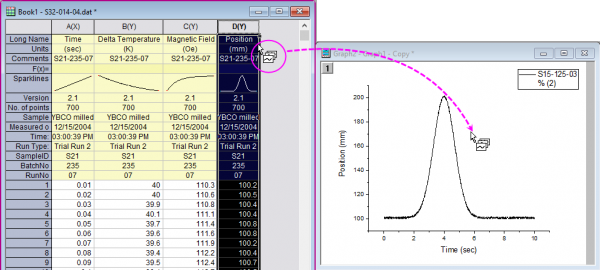
- A new curve will be added into the graph.
- Click to select the third sheet "Trial Run 3" of source workbook and select its col(D) and drag-and-drop it into the graph window to add one more curve into the graph layer.
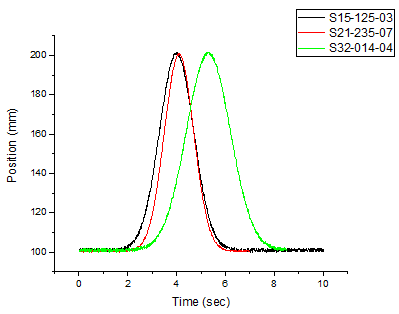
- Now, you have a graph with three curves in the layer.
| Alternately,
you can use Copy for Plotting button on the mini toolbar to add the plot in step 3 and 4. That is
- Click to select the second sheet "Trial Run 2" of source workbook, and then click on the column header of col(D) to highlight it. Click the Copy for Plotting button
 on the mini toolbar that appears. on the mini toolbar that appears.
- Activate the graph window. Right-click on the white space inside the layer to select Paste: Paste from the context menu.
|
Using Plot Setup
- Right-click on the title bar of Graph1 to select Duplicate from the context menu to duplicate the graph window.
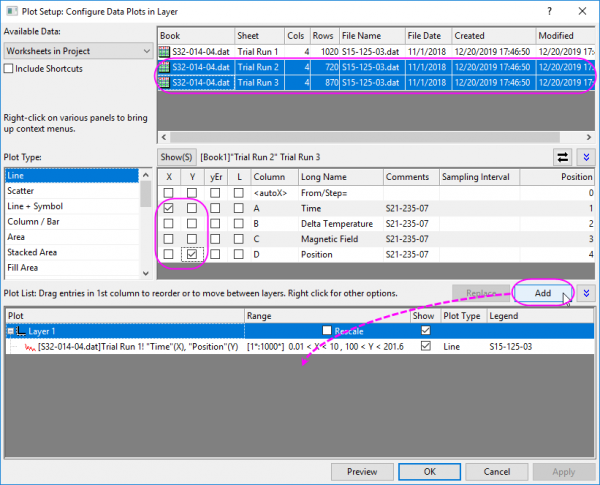
- Activate the new graph window, right-click on the layer 1 icon in the upper-left hand corner of the graph and choose Plot Setup.
 | There are three panels in the Plot Setup dialog. Expand the Plot Type panel by clicking  then expand the Available Data panel by clicking the second button. then expand the Available Data panel by clicking the second button.
Please refer to Plotting using Plot Setup for more information.
|
- Select Layer 1 in the Plot List of bottom panel. Press Ctrl key to select Trial Run 2 and Trial Run 3 simultaneously from the Available Data list (the top-most of the three panels). in the middle panel, select Time as X and Position as Y. Click Add button to add these two data into the graph layer.
Using Layer Contents
- Right-click on the title bar of Graph1 to select Duplicate from the context menu to duplicate the graph window.
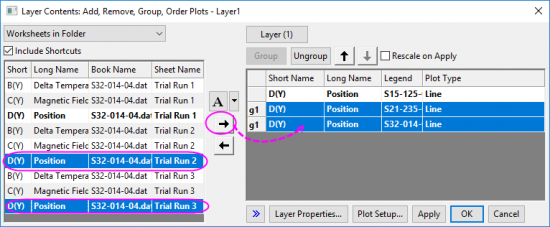
- Double-click Layer1 icon to open the Layer Contents dialog.
| Alternately,
you can choose menu Insert: Plot to Layer to open the Layer Contents dialog.
|
- In the dialog, select Col(D) of Trail Run 2 and Trail Run 3 both in the left panel and then click the button
 to add these two columns into the graph layer Layer1. to add these two columns into the graph layer Layer1.
- With the two new plots has been selected in right panel, click Ungroup button to ungroup them firstly. We will group all these three curves together later.
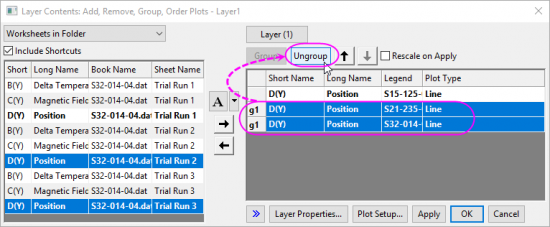
- Click OK button to close the dialog.
Using mini toolbar
- Highlight col(D) of sheet "Trail Run 2" to select Plot > Basic 2D: Line menu to plot a new graph with one curve.
- Highlight col(D) of sheet "Trail Run 3" to select Plot > Basic 2D: Line menu to plot another new graph with one curve.
- For these two graphs, click on the curve, in the popup mini toolbar, click the Copy Plot button to copy current plot. Activate Graph1 you created at the beginning back, right-click on the white space of the layer to select Paste: Paste from the context menu to paste the curve to the graph layer.
- Once you copied and pasted all these two new plots into Graph1, you will get a graph with three curves.
Grouping plots in Object Manager
Once you had added multiple curves into the existing graph layer, these curves might not be grouped which makes you not be able to apply incrementing line formats(such as Line color and Line styles).
Now, let us group these plots.
- Activate the graphs with three curves. At the right-top corner of the workspace, there is a panel named as "Object Manager" and listing all plots in current graph.
- Right-click on the last plot to select Set as Group End from context menu.
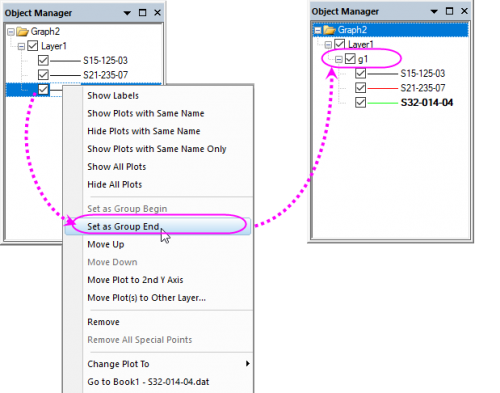
- You can see these three curves have been grouped and with incrementing line color.
Updating the Graph Legend
The existing graph legend uses the names of the imported data plots. We will modify the legend to show the sheet name.
- Right-click on the legend object and choose Legend: Update Legend.
- From Auto Legend Translation Mode, choose Custom.
- For Legend Custom Format(@D, @LU etc), click the arrow to the right and choose @WS: Sheet Display Name and click OK. The graph legend now reads Trial Run 1, etc.
For more information on customizing the default legend, see these topics:
|